
GBP/JPY Long band scalp by Charts101 on TradingView.com
AUD/JPY short at trend line by Charts101 on TradingView.com
CAD/CHF retrace to 50 fib entry by Charts101 on TradingView.com
A scalp based on:
What else is on the chart:
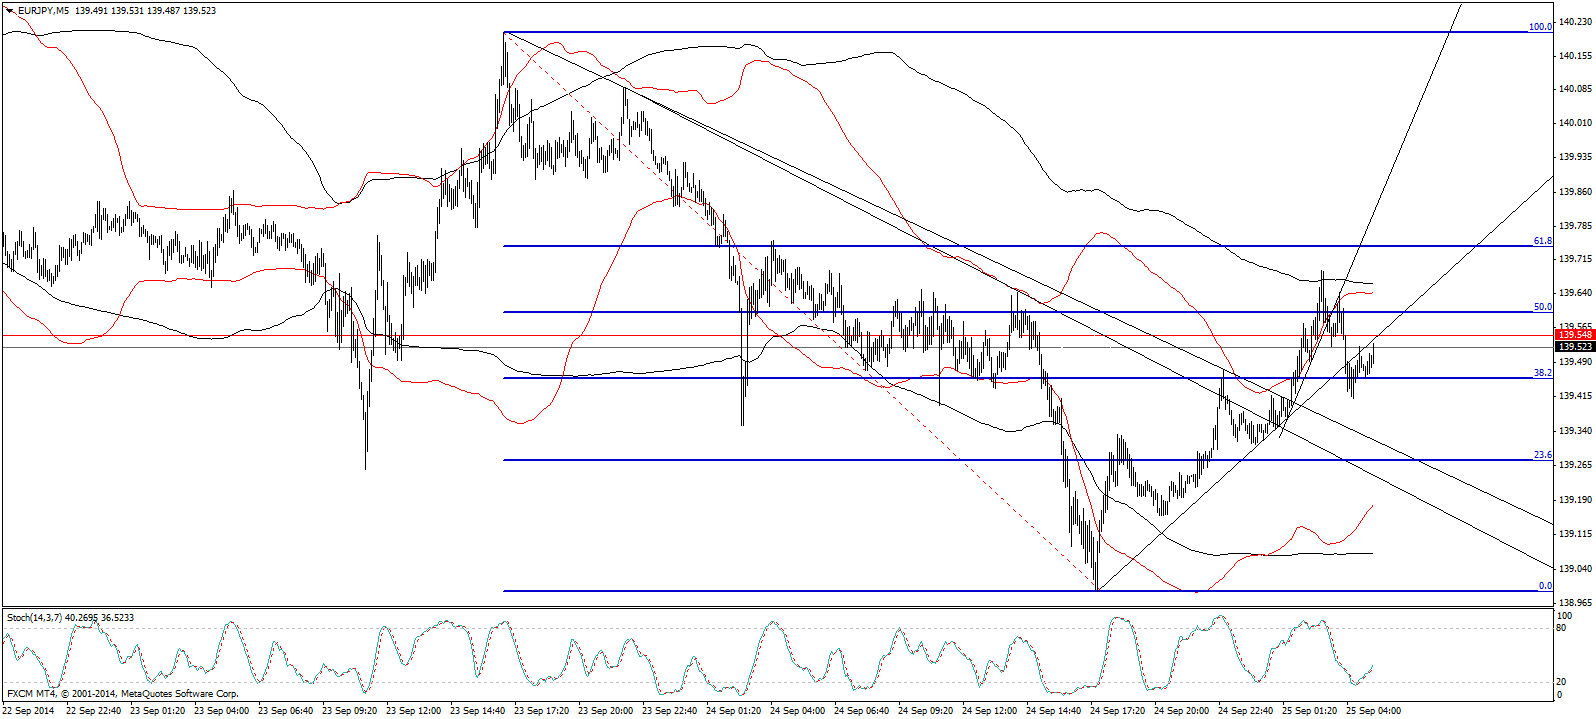
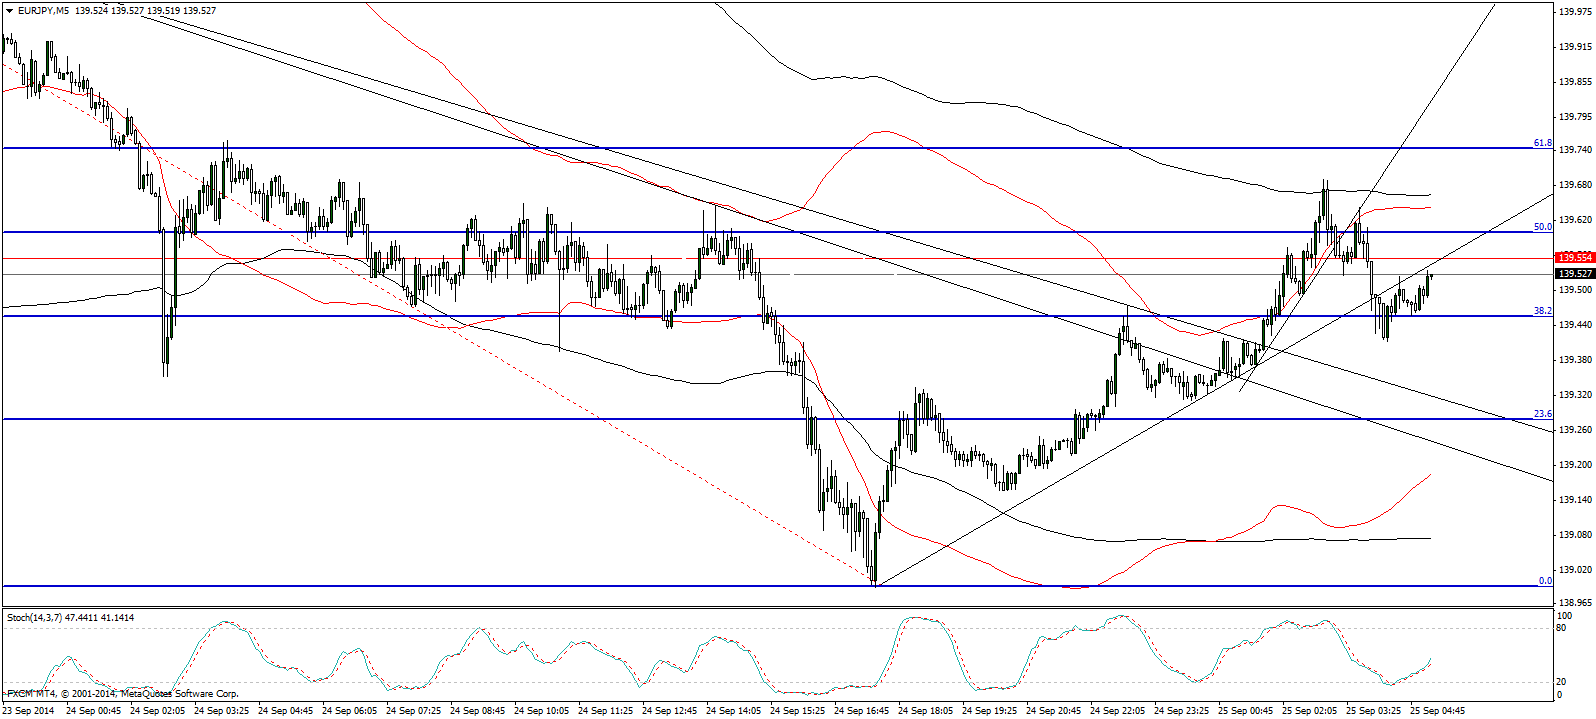
These 4 images show a trade after I exited.
The following are 5 minute charts 9/24 evening, NY time.
The 3rd chart shows the entry and exit
There was a break of a long downtrend and some strength on the move up
A steeper, short uptrend line was drawn, and when it broke a short was taken. As soon as I entered the trade started taking heat as the steep trendline was going to be tested.
I exited about 40 minutes later, after the price broke down (through another longer trendline)
8 pips profit.
The price actually made 4 lower lows after that (>100 pips).


Recent trades
4/11 eur/usd -16 pips
5/5 usd/cad +15 pips
5/7 eur/jpy +1 pip
6/2 eur/jpy +3 pips
8/13 eur/jpy -12 pips
8/25 eur/jpy +19 pips
8/26 eur/jpy +13 pips
9/3 aud/usd -22 pips
9/4 eur/jpy -19 pips
9/8 eur/jpy +10 pips
9/9 eur/jpy +1/2 pip
9/11 eur/jpy +11 pips
9/17 eur/jpy +4 pips
9/21 eur/jpy +1 pip
9/22 eur/jpy +1 1/2 pips
9/23 eur/jpy +1 pip
9/24 eur/jpy +8 pips

