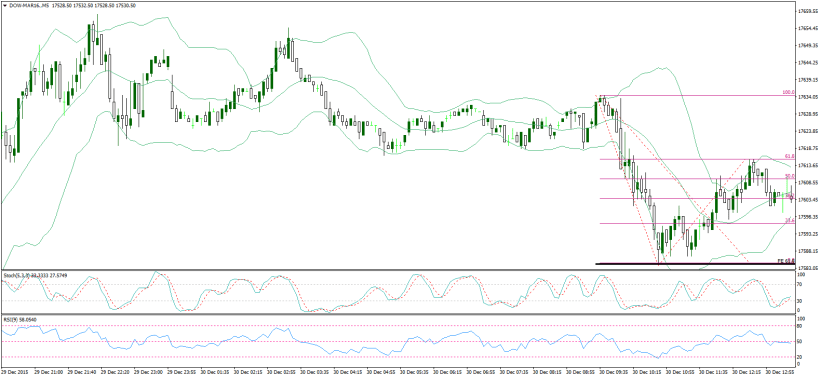
Dow Fibonacci entry


Here is an example of a potential entry based on a fibonacci retracement (thin purple lines).

This is how the market looked at about 7 am NY time.


Targets were estimated based on the fibonacci expansion levels (thick black lines) of the same move.

The idea is that many times the 100 expansion level is reached.

As we talk more about bollinger bands, we’ll see that there was another reason for the entry, even if only for a quicker “scalp”
 

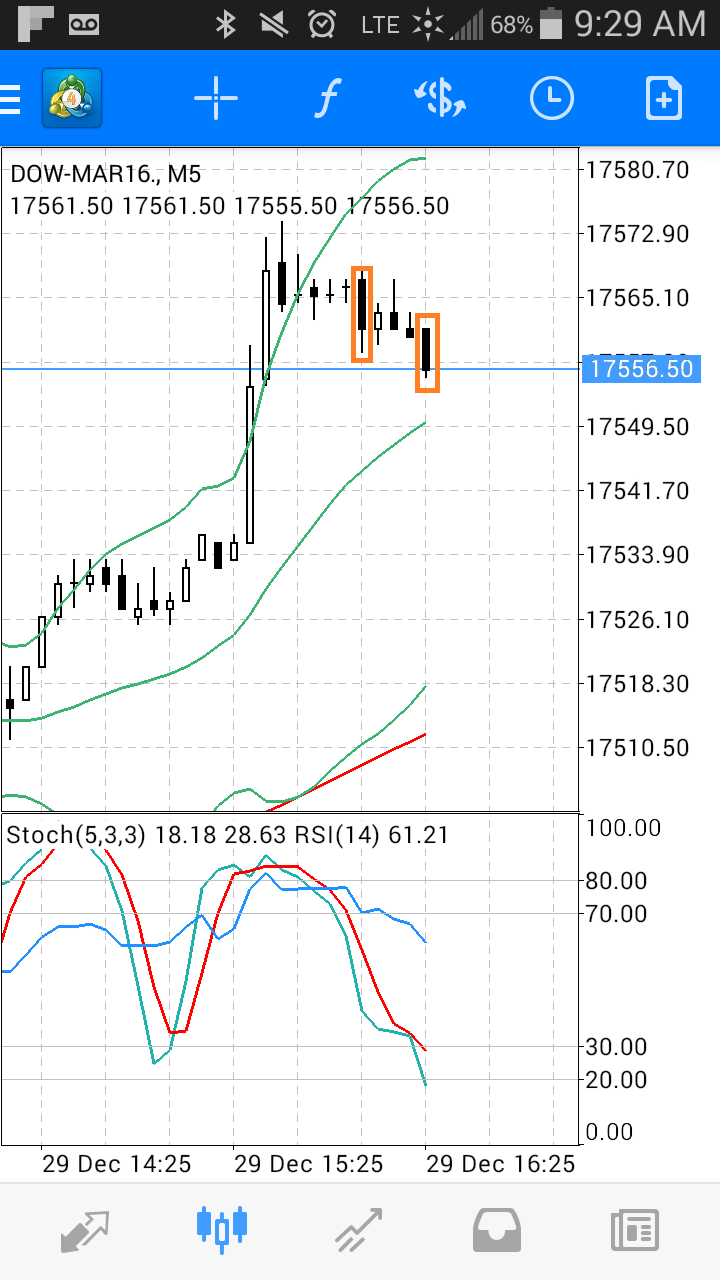
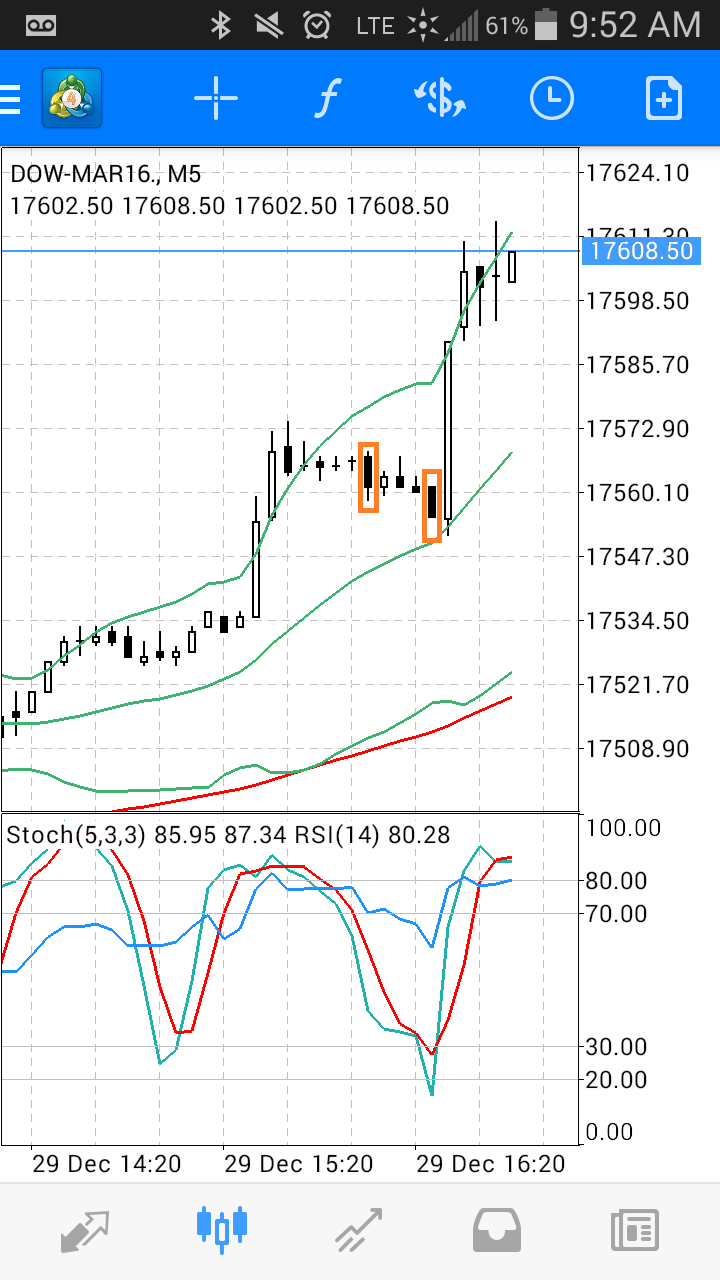
DOW-MAR16.M5DOW-MAR16.M5-2


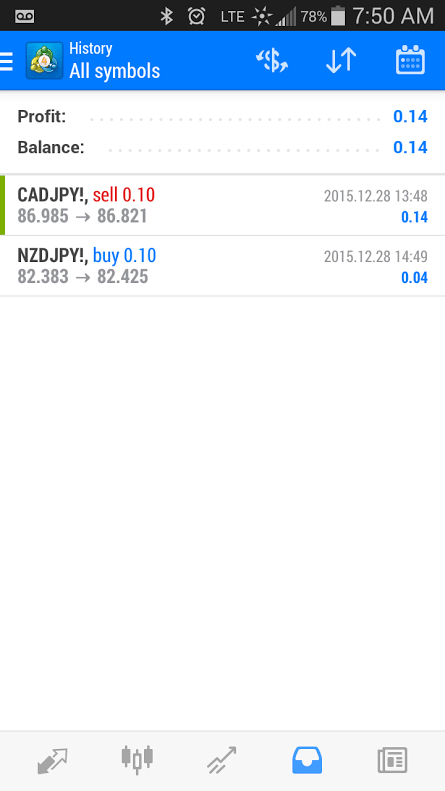
Short CAD/JPY | Long NZD/JPY

Hello all,

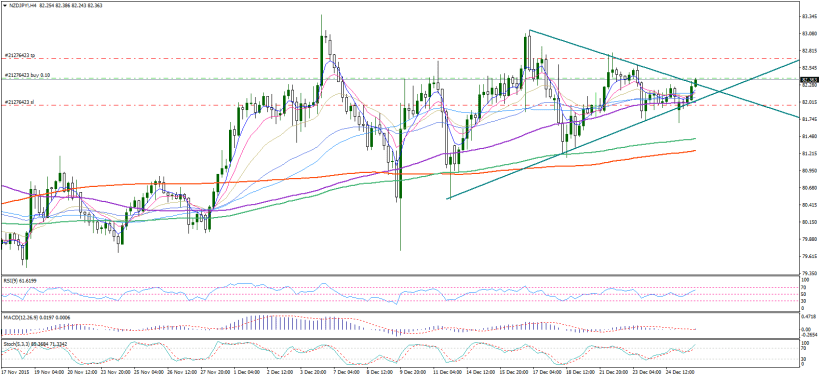
I didn’t do all that much analysis on these pairs, however I took a shot last night. Entered at market and placed a stop loss and take profit for each.

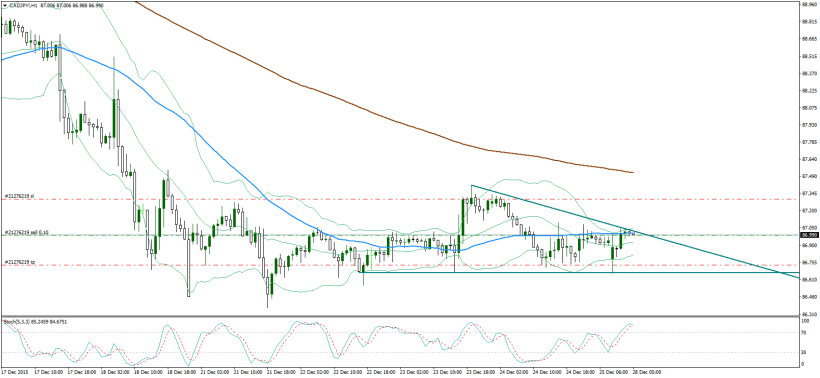
These were based on triangles. Playing into a triangle and breaking out of a triangle.

I closed them both manually in the morning for less than the initial take profit.

cadjpynzdjpy


cadjpy-h1-noble-services-ltd1228nzdjpy-h4-noble-services-ltd1228