Dow scalping – bollinger bands

“DOW posts worst start to year ever” – CNBC

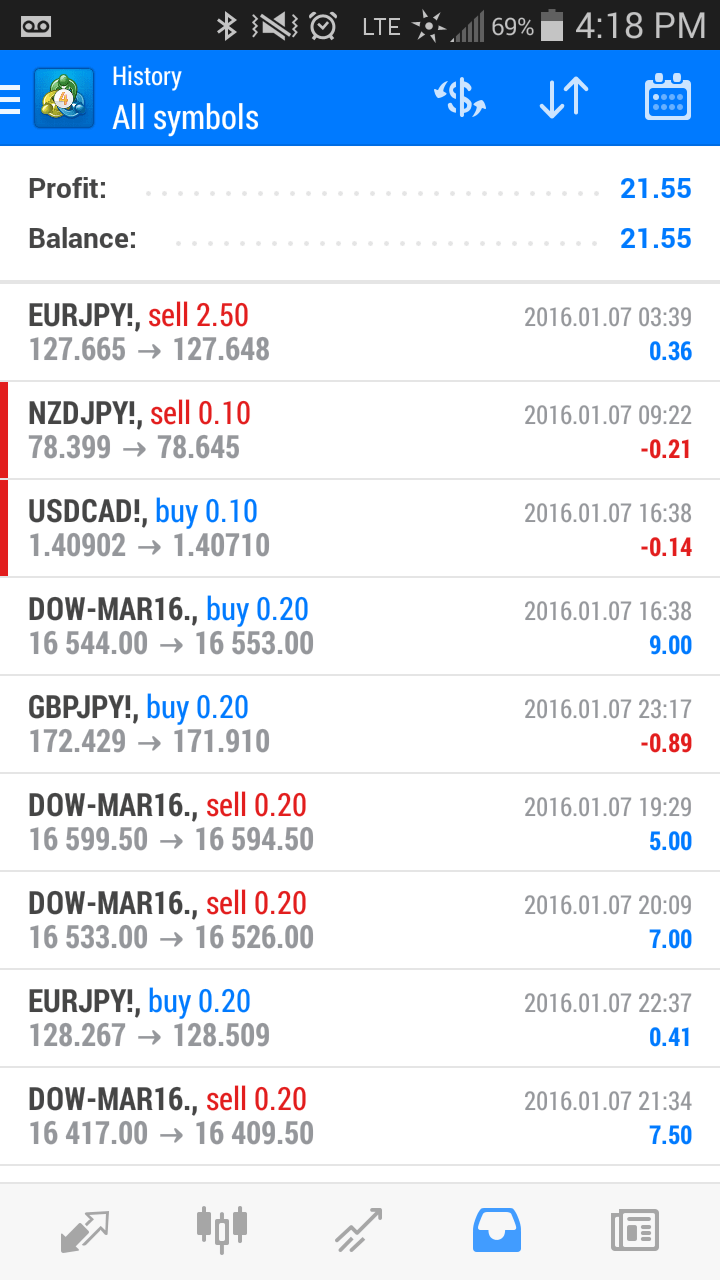
Various shorter term trades below. Some have losses of many pips.

DOW trades went 4 for 4.

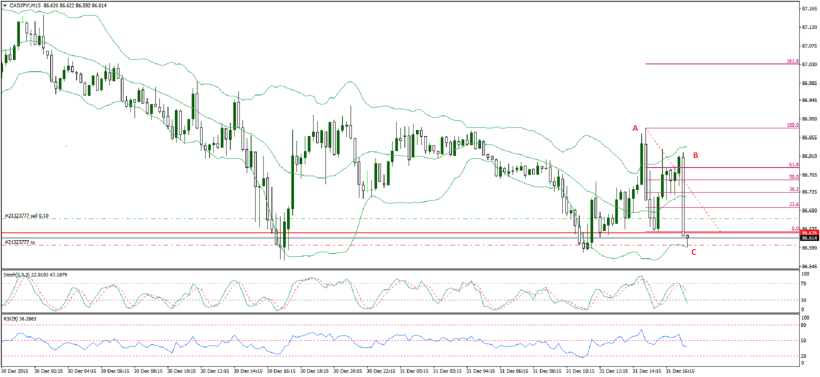
The highest point on this chart was at a 61 fibonacci level, and on the 30 minute chart there was an inside bar formation.

I’m also floating a very small loss on the USD/CAD.

See list of trades below –


Screenshot (04-11PM, Jan 07, 2016)Screenshot (04-18PM, Jan 07, 2016)


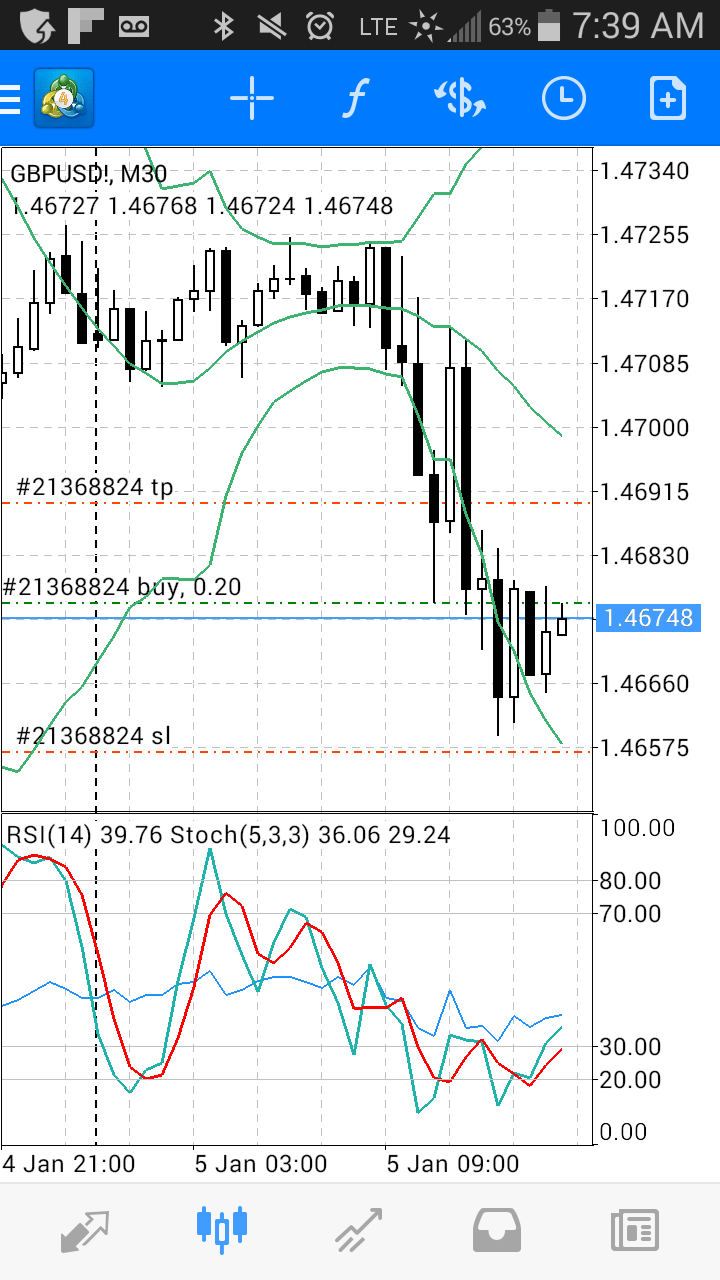
GBP/USD – scalp with bollinger bands

I took this trade due to the inside bar on 30 minute chart.

Price was staying inside the band after closing outside of the band, and forming an inside bar.

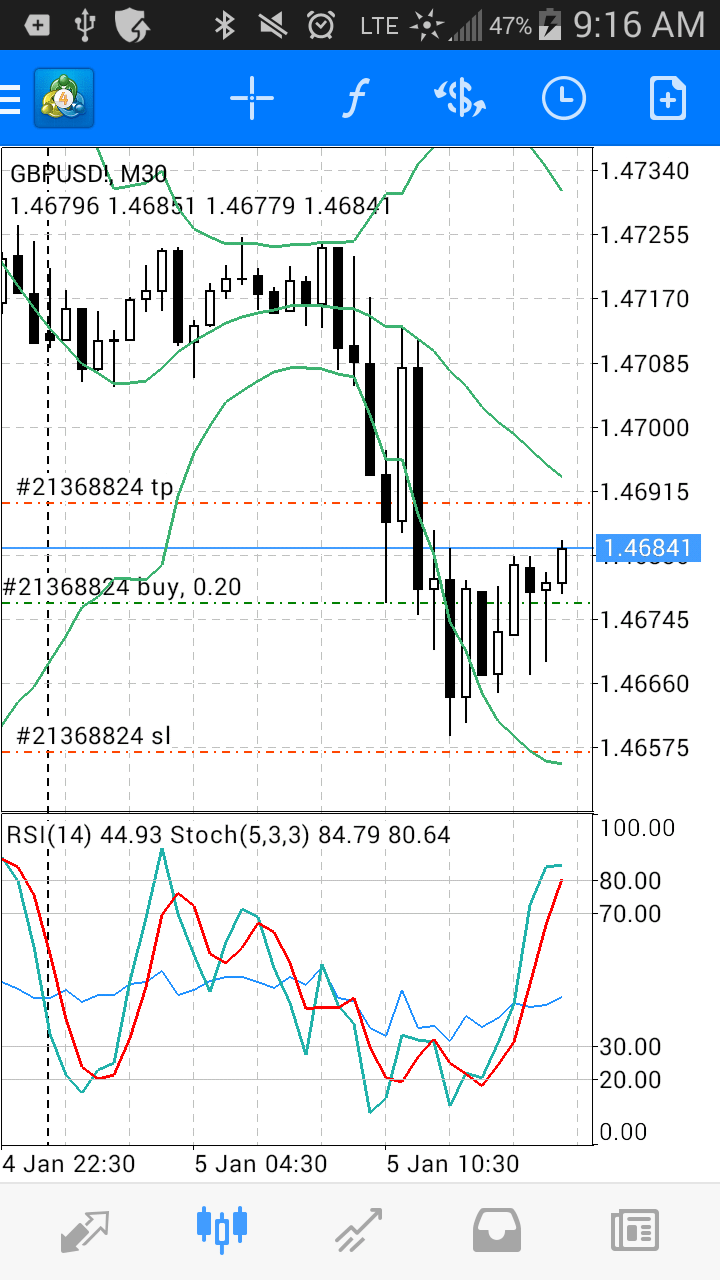
We can see entry, stop loss, and take profit.

We can also see that I exited early, and the price action afterwards. A very nice short was available

1.4676 entry

1.4684 exit

Screenshot_2016-01-05-07-39-05 (1)Screenshot_2016-01-05-09-16-39Screenshot_2016-01-05-11-53-54

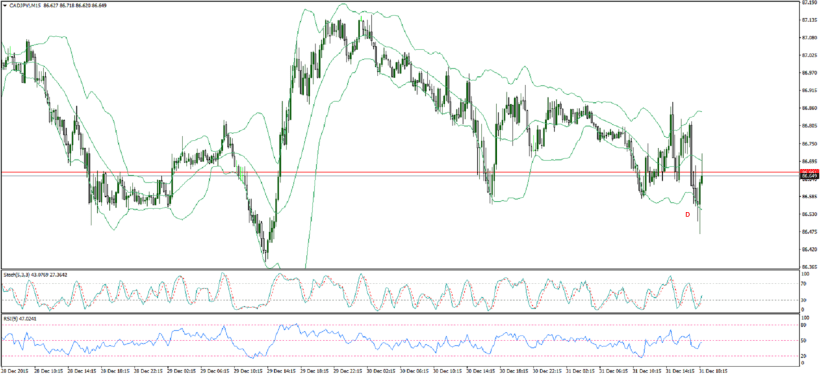
CAD/JPY – scalp with bollinger bands

A.    This in an engulfing pattern after a close outside of the band. We should note that the candles are relatively large 

B.     The price went up against the short position (see the green dotted line – I did not have a stop loss order in). All I thought of was to draw a fibonacci retracement to see where price could stop. It closed above the 61 level but then moved down with momentum.

C.     The green dotted line was a limit order to take profit which was filled.

D.    Price went 10 pips lower.

Notice anything else?  What can we learn?

CADJPY!M15

CADJPY!M15-2