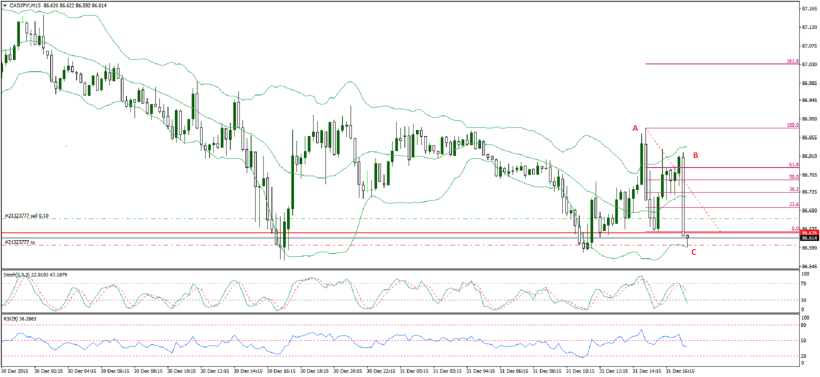
A. This in an engulfing pattern after a close outside of the band. We should note that the candles are relatively large
B. The price went up against the short position (see the green dotted line – I did not have a stop loss order in). All I thought of was to draw a fibonacci retracement to see where price could stop. It closed above the 61 level but then moved down with momentum.
C. The green dotted line was a limit order to take profit which was filled.
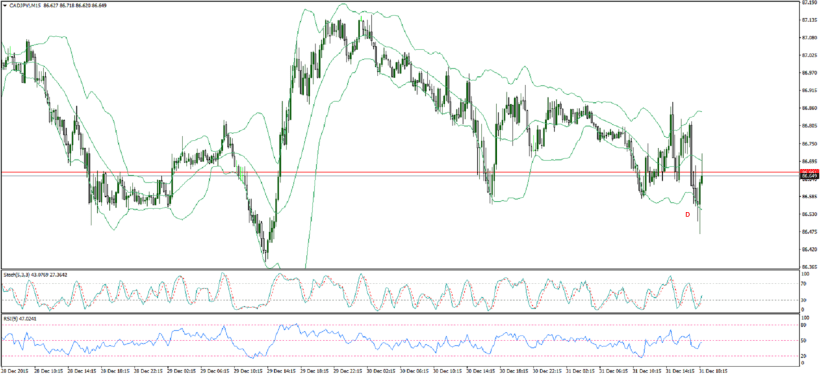
D. Price went 10 pips lower.
Notice anything else? What can we learn?