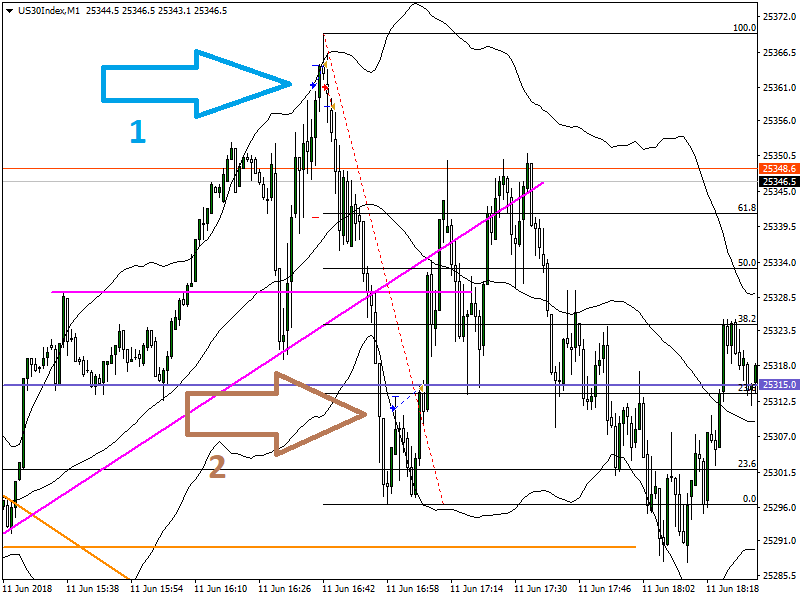
Blue Arrow (1) shows a long trade and small profit. Just after that, the market snapped back. A short trade and another small profit was taken.
At that point I watched the price move down and wanted to see if there would be any support at the (magenta) horizontal line. It kept falling and finally formed a morning star type formation – Below Brown Arrow (2).
A long trade and quick profit was taken, however it did require a double bottom to form first.
These charts can look busy. They usually have a Bollinger Band and several horizontal and trend lines. You’ll see that some lines are black, some are orange, and others pink or magenta. You can use colors to signify a longer vs shorter term drawing.
Do you see the 23.6 level near the number 2) ?
It’s interesting that the morning star pattern / double bottom happened at that level. Ideally, since it was a larger drawing from possibly a 30 minute chart, it would be a different color, or bold.