Today we had 2 scalp type trades. On a 15 minute chart (not shown) a few horizontal lines and trend lines were drawn.
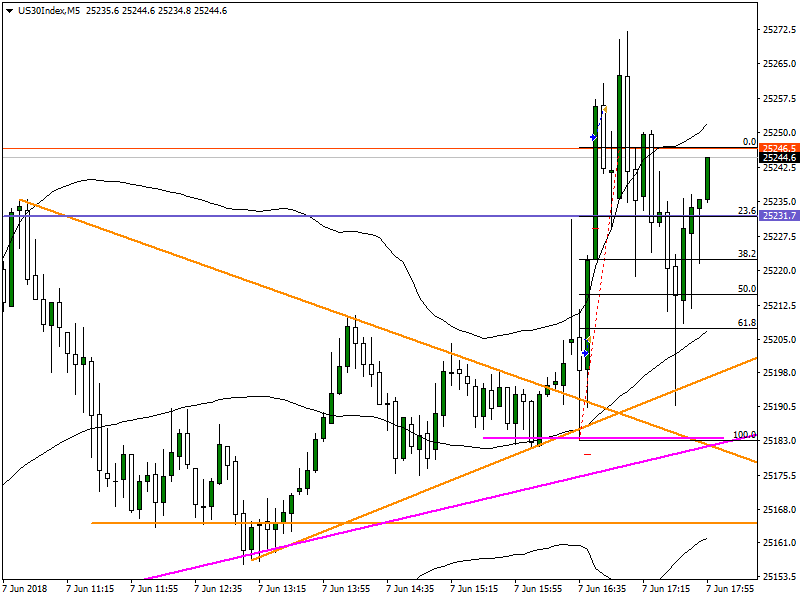
The 5 minute chart below shows that after the stock market opened (this is a CFD so it was already trading) the market soon broke out and created a doji with a long upper tail. Then it pulled back.
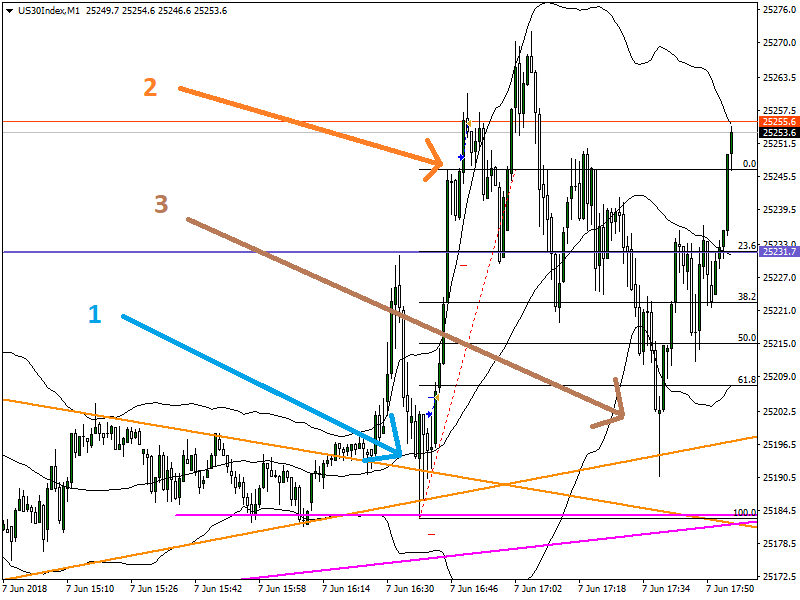
On this 1 minute chart, blue arrow (1) shows that pullback forming several long tails around the downward sloping orange line that had been drawn. A long trade was taken as well as a quick small profit.
Then after a strong move up and and a pause (doji which is an inside bar) a Fibonacci retracement was drawn. The price could not even make it to the 23 level and once it broke higher another long trade and small profit was taken (orange arrow (2)). The Fib would be removed however I want to show the process. If you wanted to hold the trade longer, where would your stop loss be? In this example we can see that the price moved back down to the horizontal line and then had another strong rally.
Brown arrow (3) shows that later price formed a classic morning star pattern at about the level where the market opened.