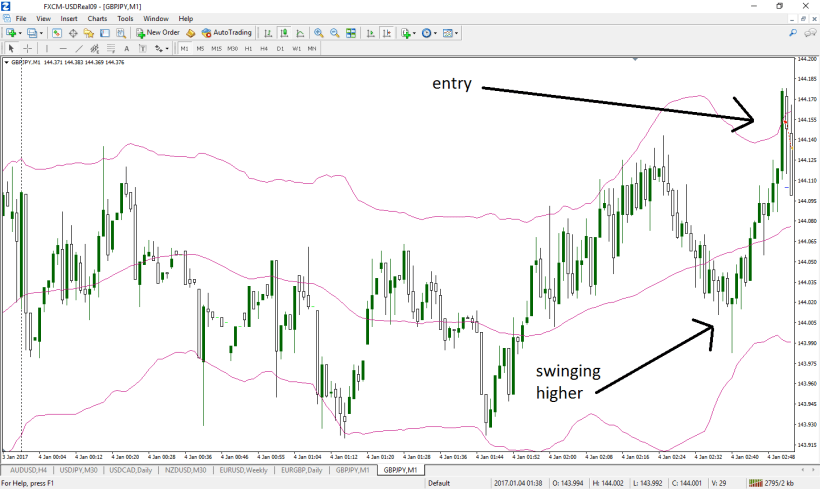
This was a scalp for a couple of pips shown on a 1 minute chart
I’m showing the entry with what could be a hint of the move to come (swinging higher)
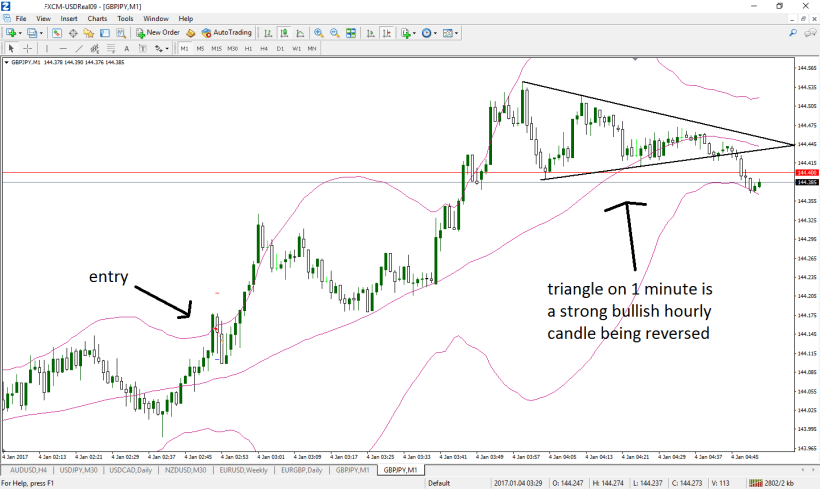
We need to monitor price action to determine when to NOT wait for the lower band area to be reached before taking long positions. The second image has a nice entry around the mid band, which is a 20 period moving average. Can you find it?
I’m not showing the hourly chart in this example, however it was the main reference time frame. Really, this can be considered against trend, as it was a short trade.