Dow short trade – 1 Minute Chart – Early U.S. Session

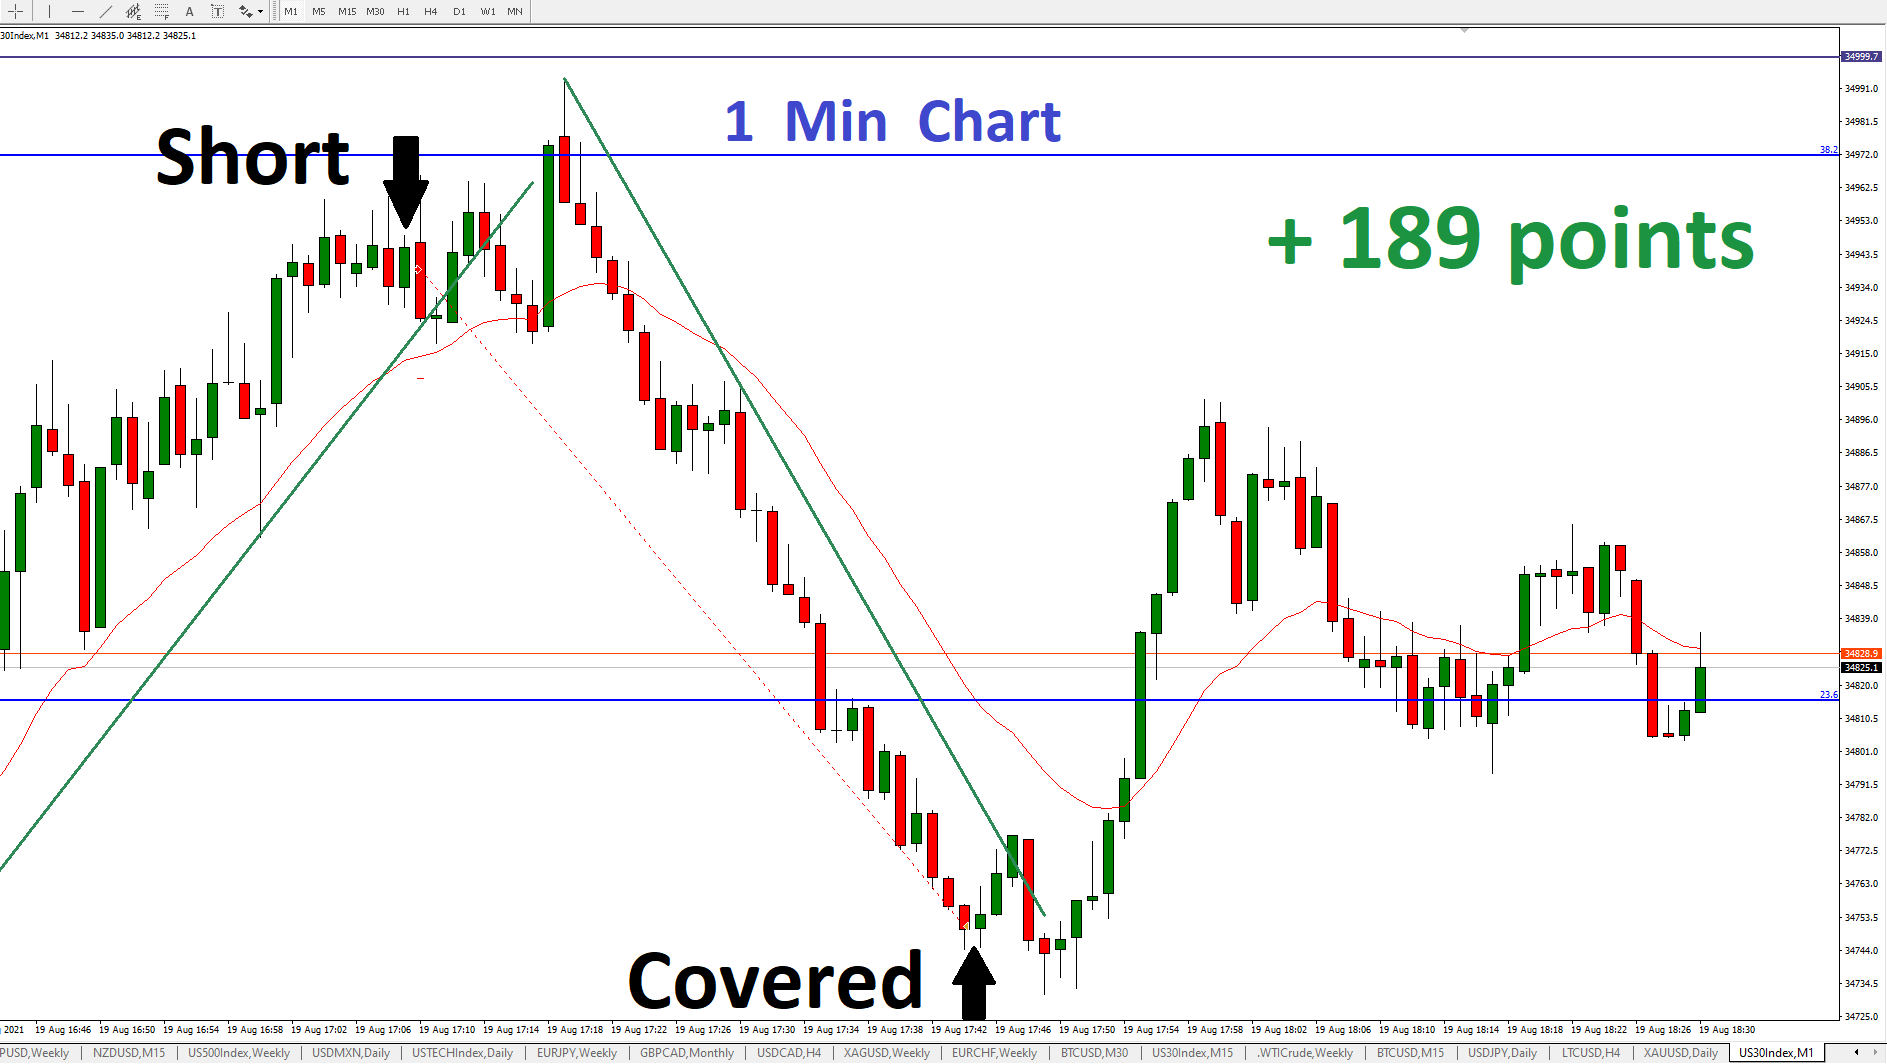
This trade yielded 189 points. There was a Fibonacci retracement drawn on a longer term time frame.

A short position was taken in anticipation of a trend line break. As happens frequently, price pushed higher after the trendline break, resulting in some sort of false breakout.

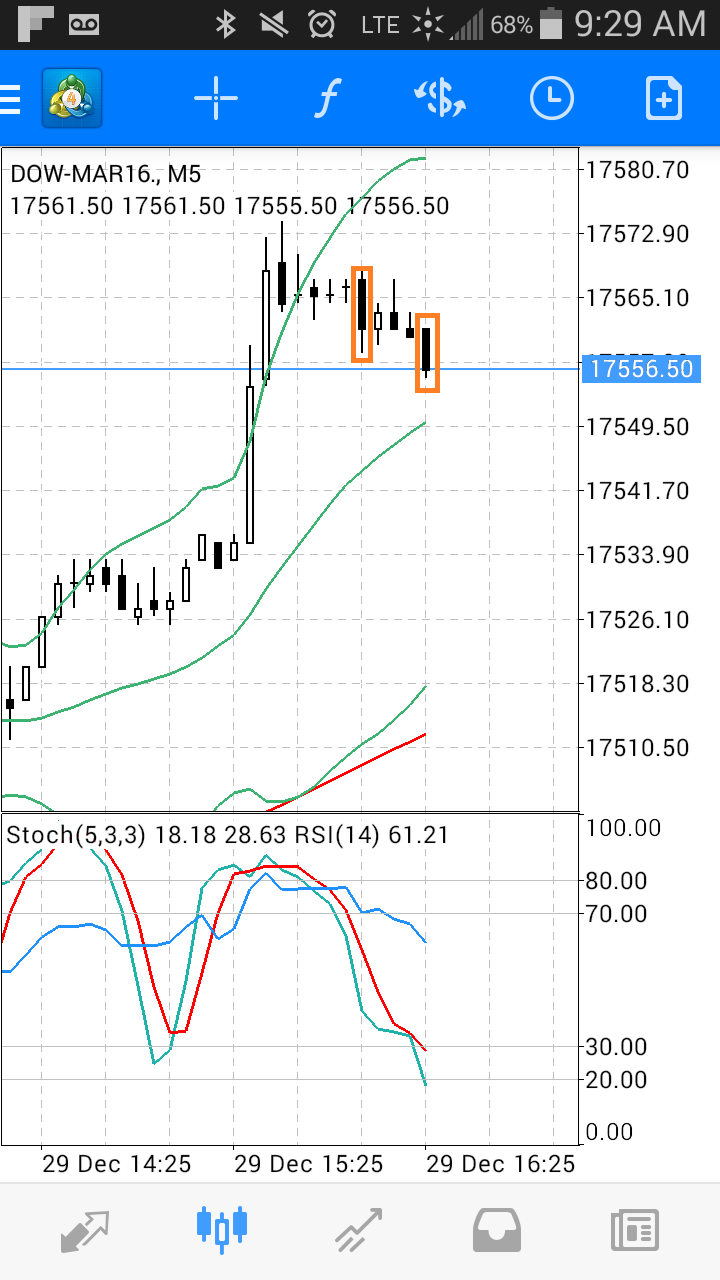
At a certain point while the trade was on, I placed a breakeven stop loss. Then I moved it to about +30 points. Then I exited manually. If you zoom out to a 5 minute chart, you’ll notice that price bounced around the area where there was a prior swing high.

CAD/JPY – scalp with bollinger bands

A.    This in an engulfing pattern after a close outside of the band. We should note that the candles are relatively large 

B.     The price went up against the short position (see the green dotted line – I did not have a stop loss order in). All I thought of was to draw a fibonacci retracement to see where price could stop. It closed above the 61 level but then moved down with momentum.

C.     The green dotted line was a limit order to take profit which was filled.

D.    Price went 10 pips lower.

Notice anything else?  What can we learn?

CADJPY!M15

CADJPY!M15-2

Dow scalp – Bollinger Bands


This was a short scalp on MT4’s mobile app based on 5 minute Dow CFD

Entry was on first marked candle, the exit was on the second

This was a risky trade, against momentum. We need to be very nimble with a trade like this.

Price screamed higher after my exit.

Therefore, the profit target was the mid band, at most


Screenshot_2015-12-29-09-29-03Screenshot_2015-12-29-09-52-38Screenshot_2015-12-29-09-29-54