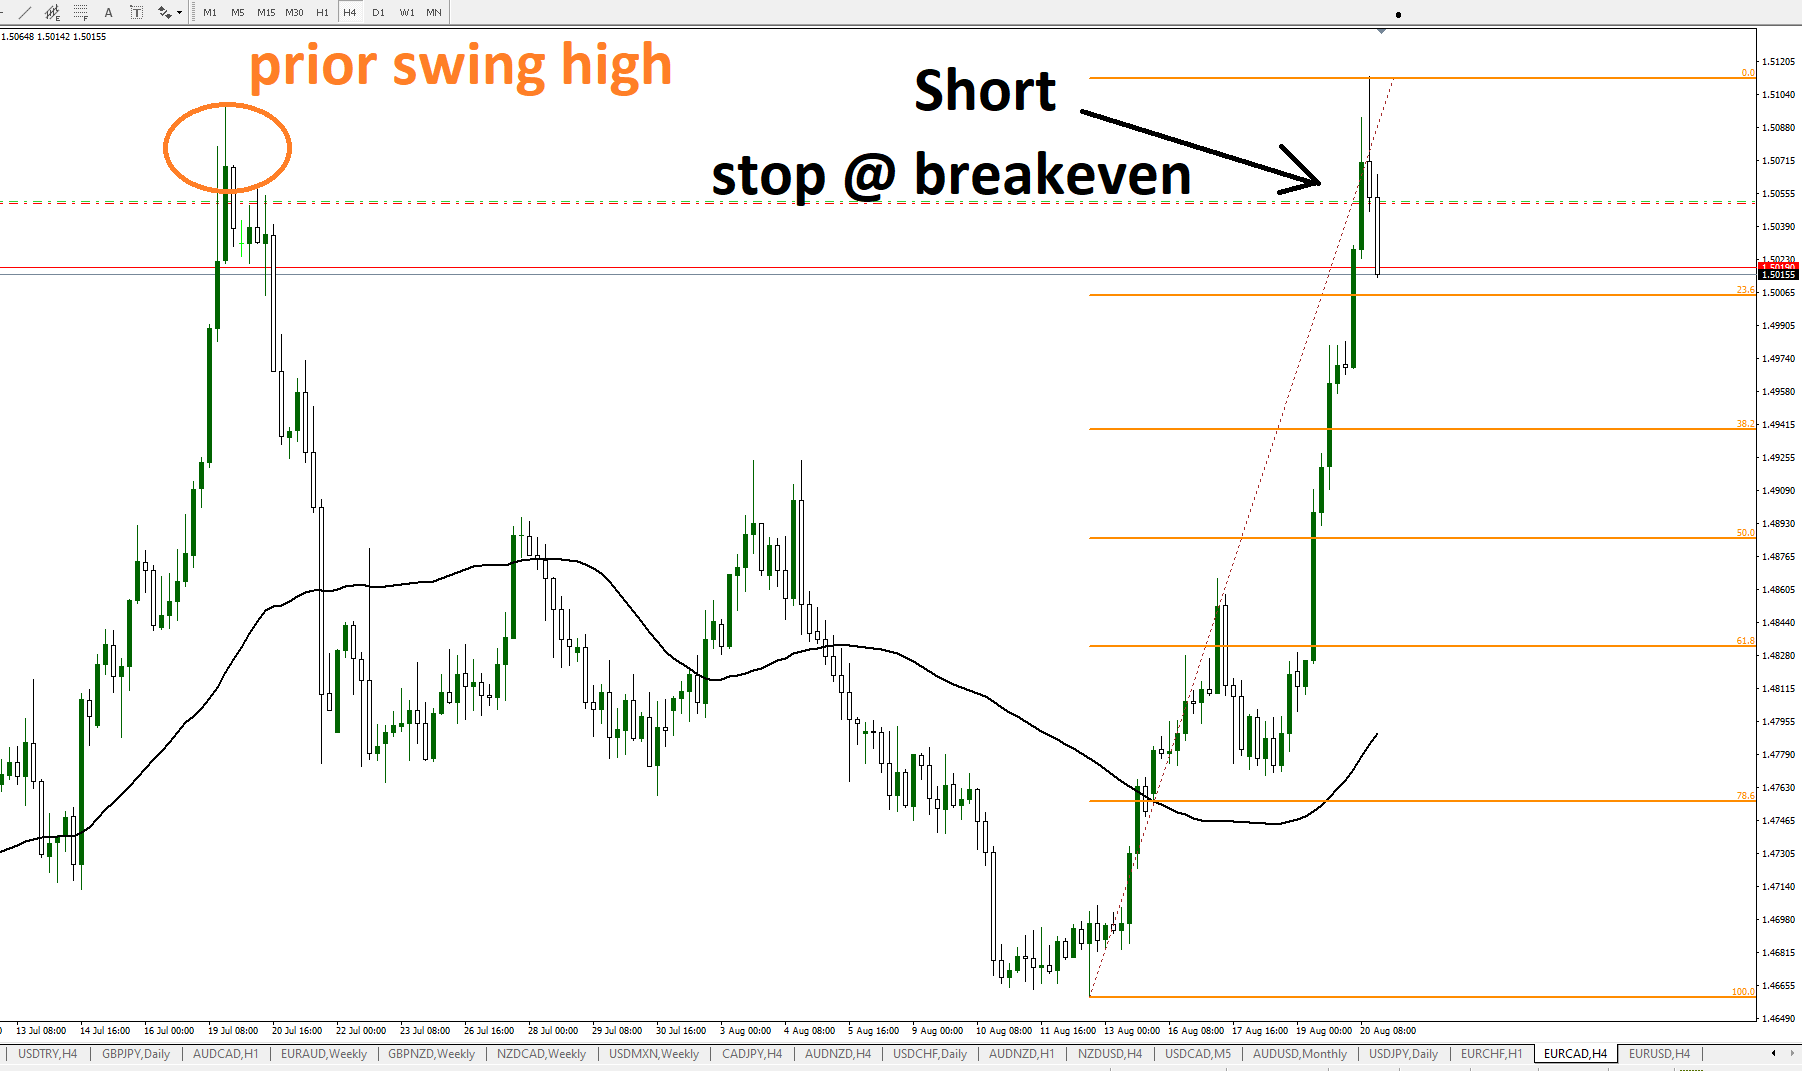
EUR/CAD – short trade 4 HR chart – stop at breakeven

I noticed the price of this pair was at a level near a prior swing high. There was an opportunity shortly after the entry to get a stop loss order in at breakeven. That was done and now we’ll wait to see how the price action unfolds.

One objective of these posts is to show that trading is work and takes some effort. This position might get stopped out by the end of session today (Friday). That would be fine. There will be opportunities next week.
CAD/JPY – scalp with bollinger bands

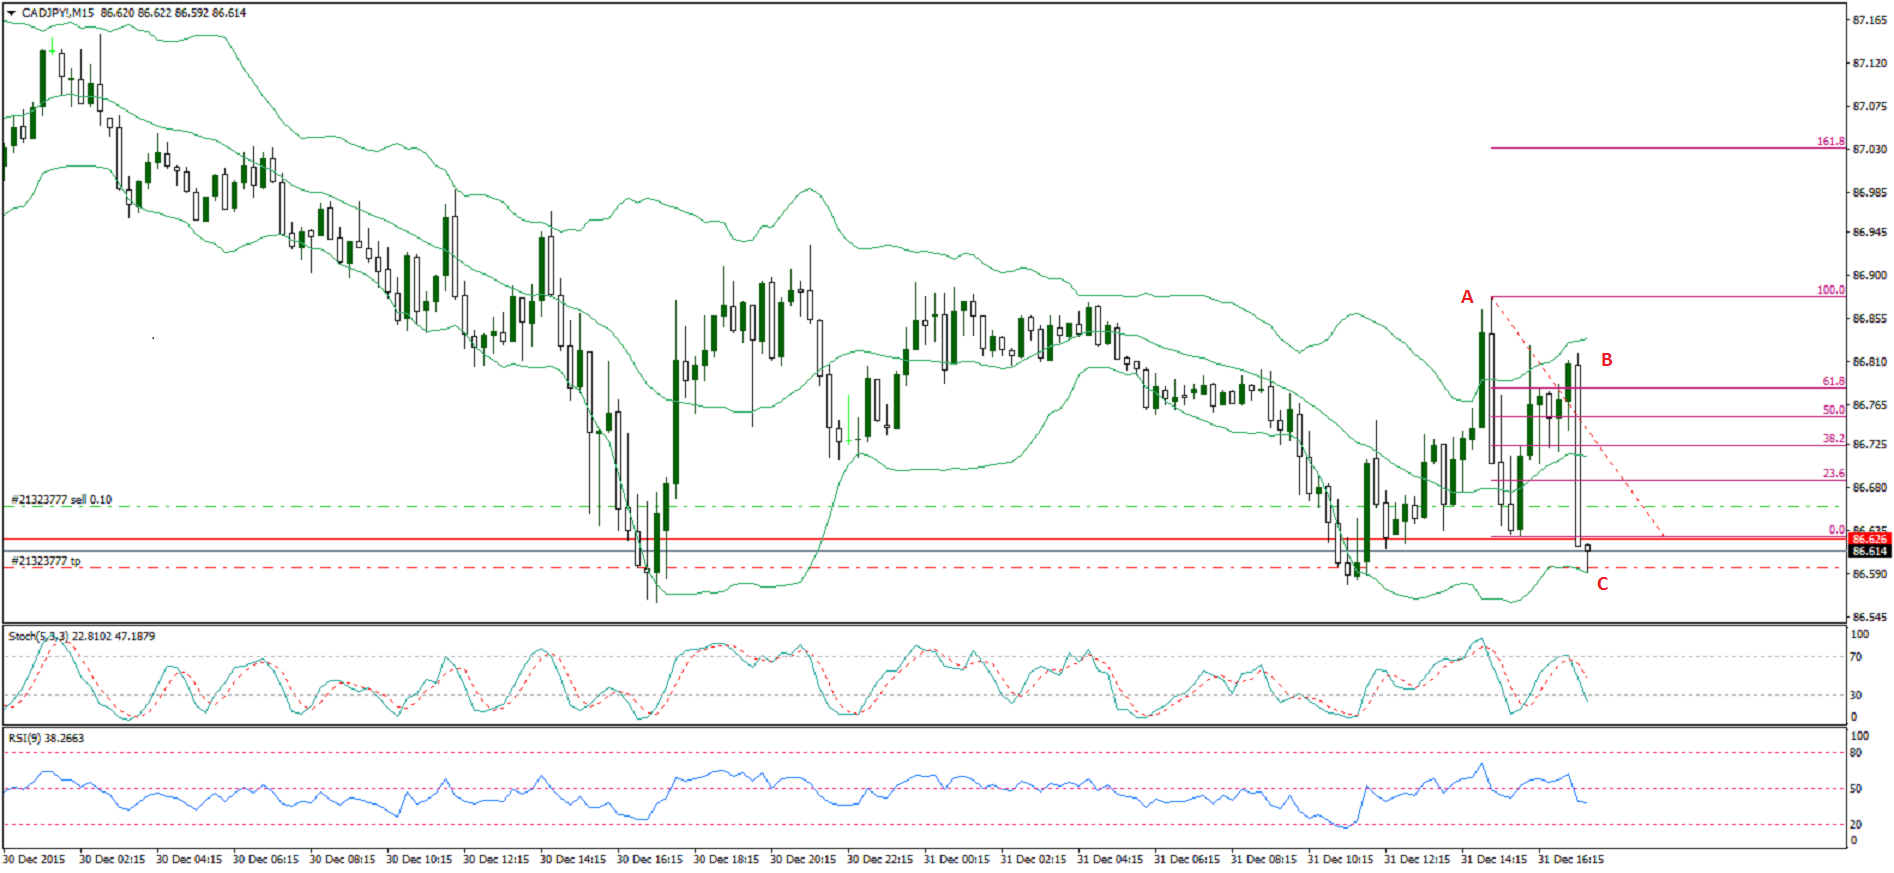
A.    This in an engulfing pattern after a close outside of the band. We should note that the candles are relatively large 

B.     The price went up against the short position (see the green dotted line – I did not have a stop loss order in). All I thought of was to draw a fibonacci retracement to see where price could stop. It closed above the 61 level but then moved down with momentum.

C.     The green dotted line was a limit order to take profit which was filled.

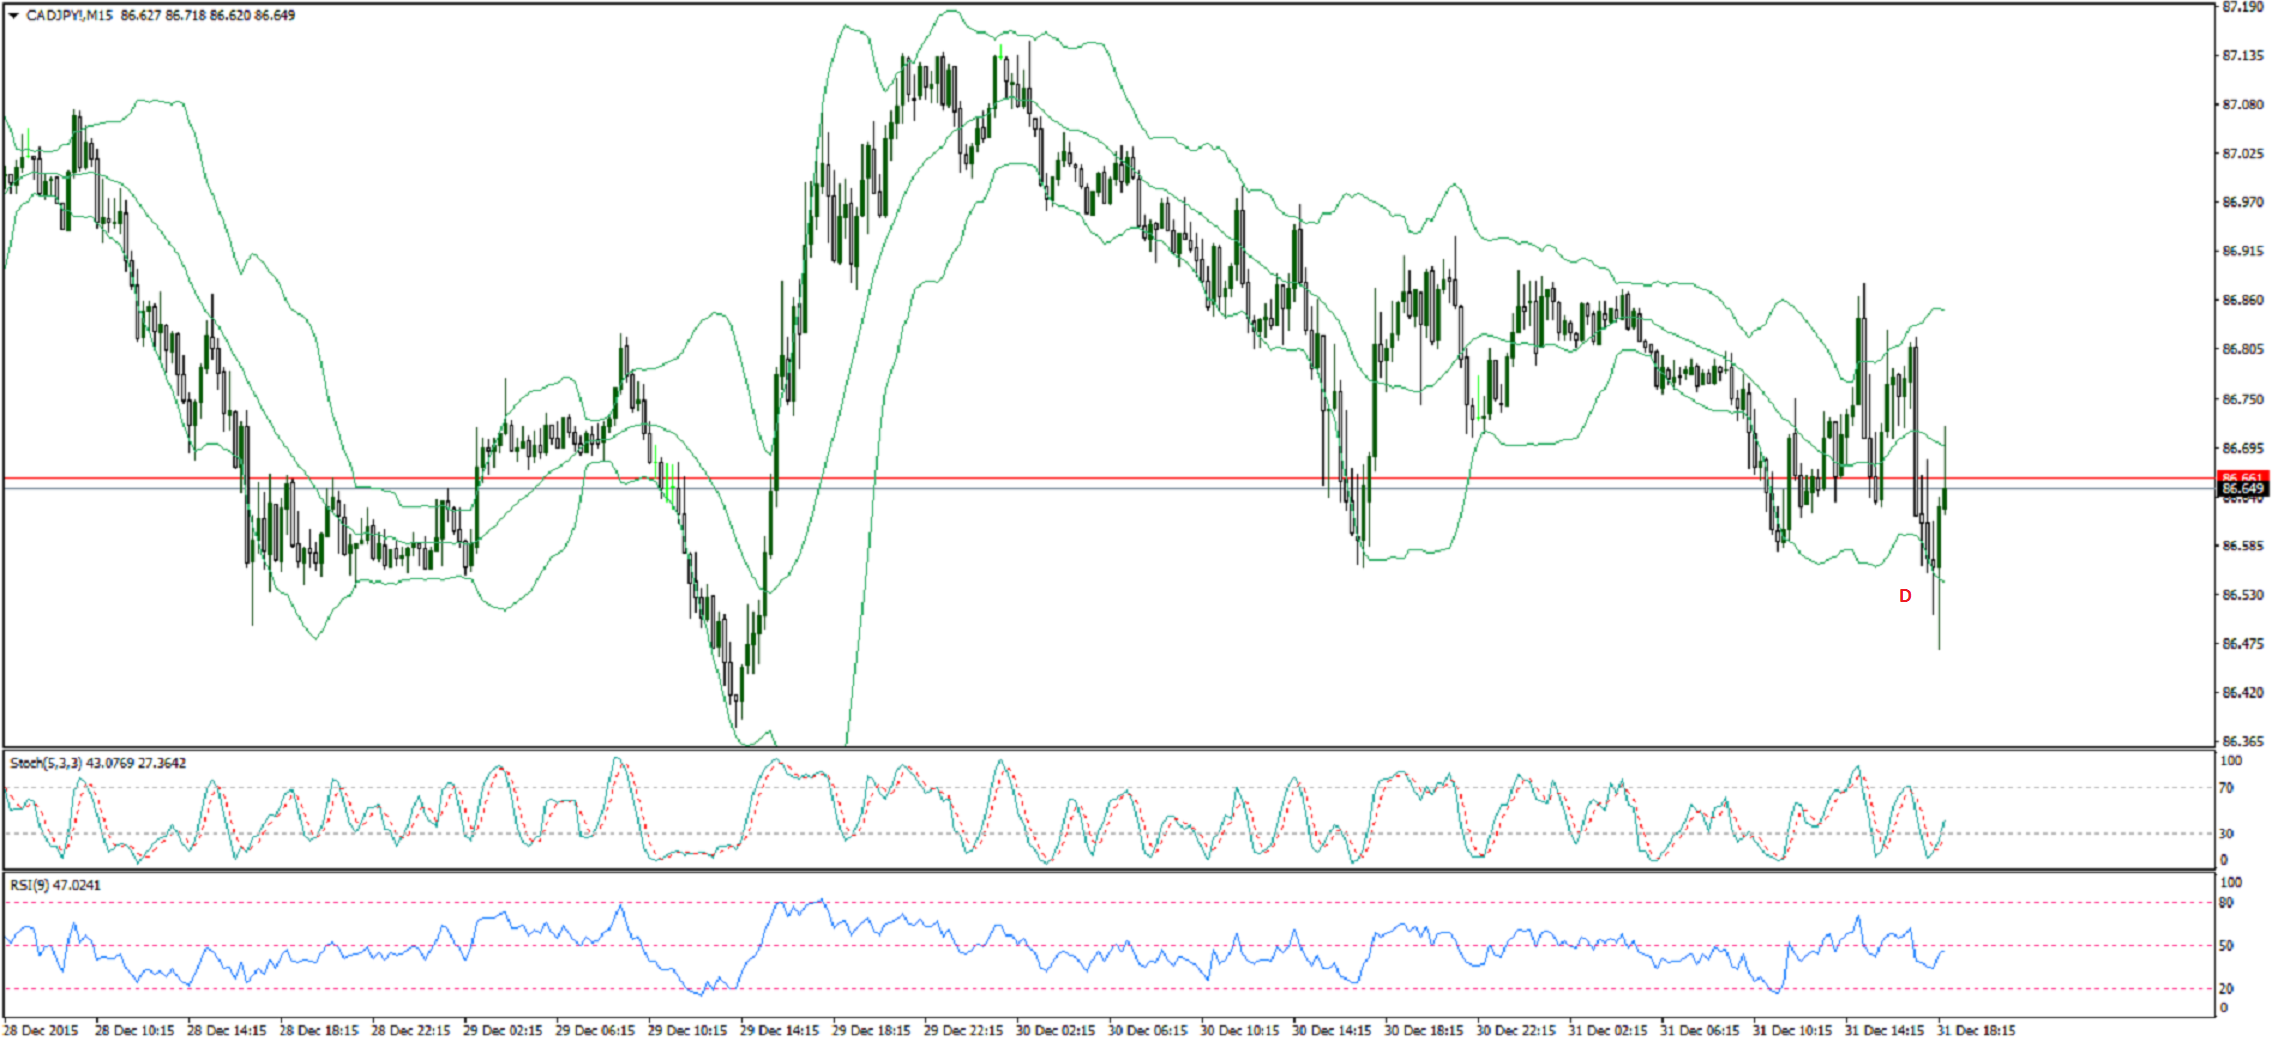
D.    Price went 10 pips lower.

Notice anything else?  What can we learn?

CADJPY!M15

CADJPY!M15-2