
Let’s look at a zoomed out view
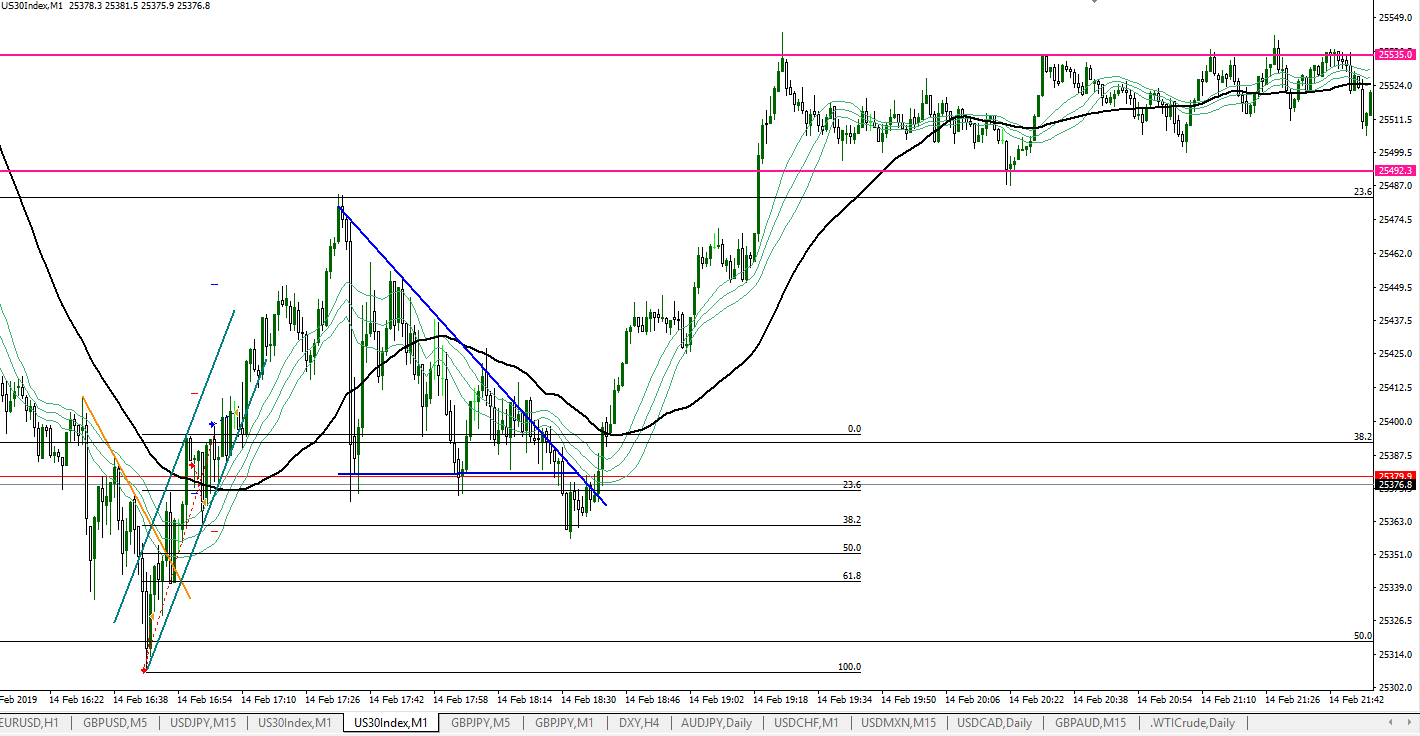
I want to point out the triangle in Blue. Note that I drew it before it broke to the bottom and moved much higher. Then later on I drew the sideways consolidation, There were a couple of scalps available during that time.
I traded earlier in the session, let’s drill in:
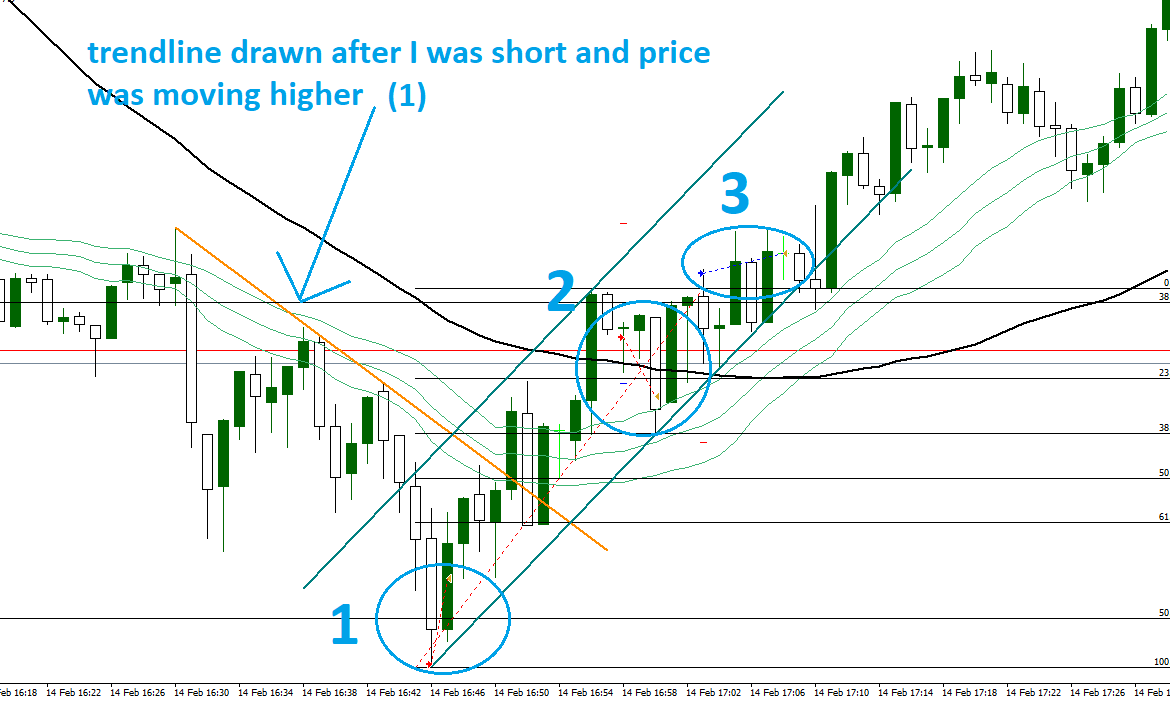
A short position was taken, basically at the bottom to the tick (1). Then the trend line was added.
The Fib looks strange on the chart because it was just a guess. I was looking for a target for the position that was just taken (2), this one profitable.
Then, a channel was drawn and I exited the 3rd trade with a profit.
This image shows the very early part of the first image. On a short term time frame we have a triangle (or wedge), a simple trend line, a channel, and a sideways range.
