AUD/CAD Daily Chart

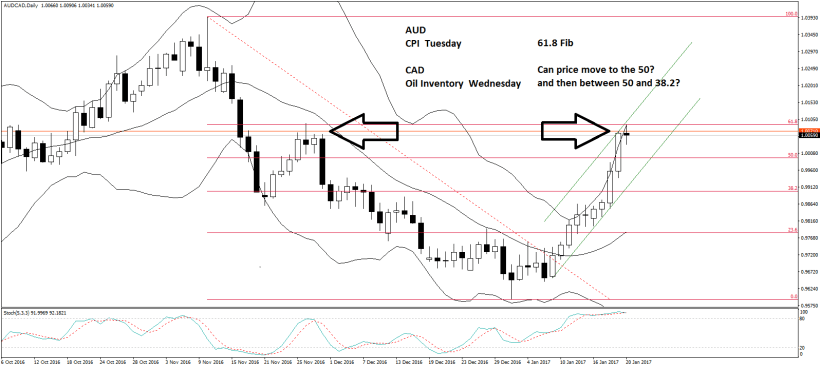
If this pair doesn’t keep shooting straight up, I think there is  30 to  100 pips of downside potential even if it moves up afterwards. About 100 pips lower than the current price is a middle band (20 period Moving Average) on the weekly chart

What do you think?


audcad-d1-fx-choice-limited-2

Leave a Reply

Fill in your details below or click an icon to log in:

WordPress.com Logo

You are commenting using your WordPress.com account. Log Out /  Change )

Facebook photo

You are commenting using your Facebook account. Log Out /  Change )

Connecting to %s