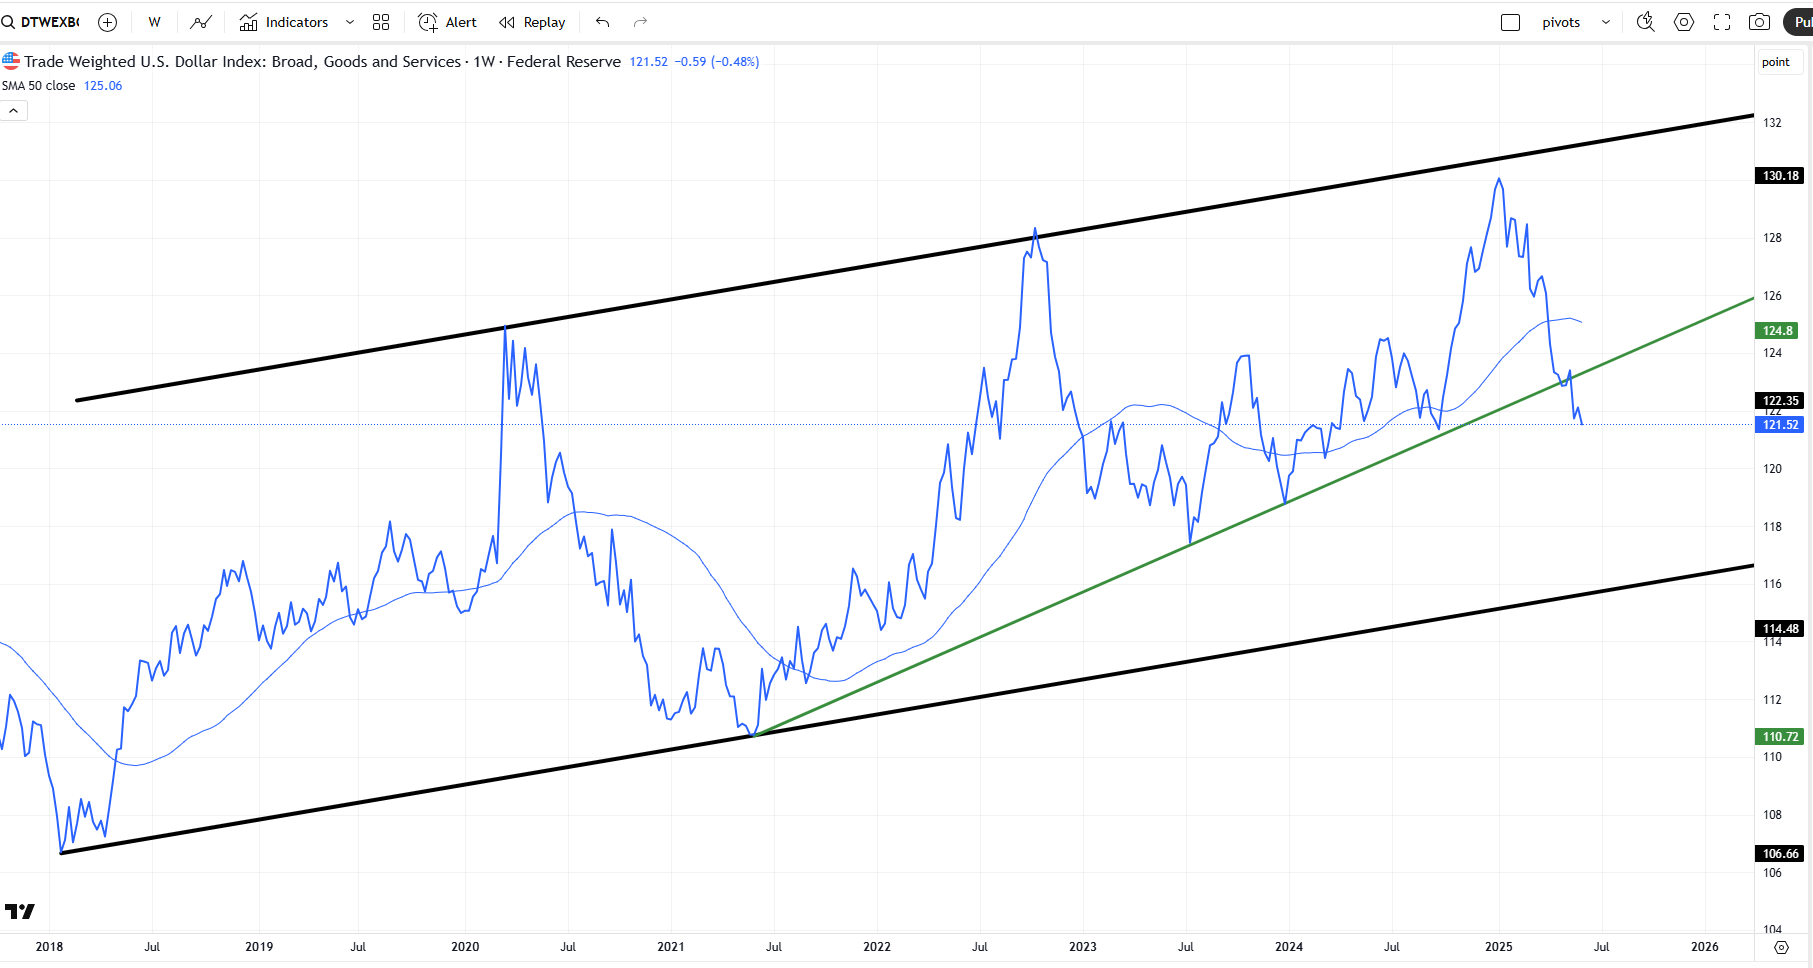
A brief update on this broad Dollar Index, It continued lower, but may be ready for some sort of bounce, as it comes into these levels

A brief update on this broad Dollar Index, It continued lower, but may be ready for some sort of bounce, as it comes into these levels
Ticker DTWEXBGS gives us a different Dollar Index.
The beginning of this year made a new high, taking out the high from October 2022.
A few weeks have closed below the trendline. Anyway, its good to know about this index.
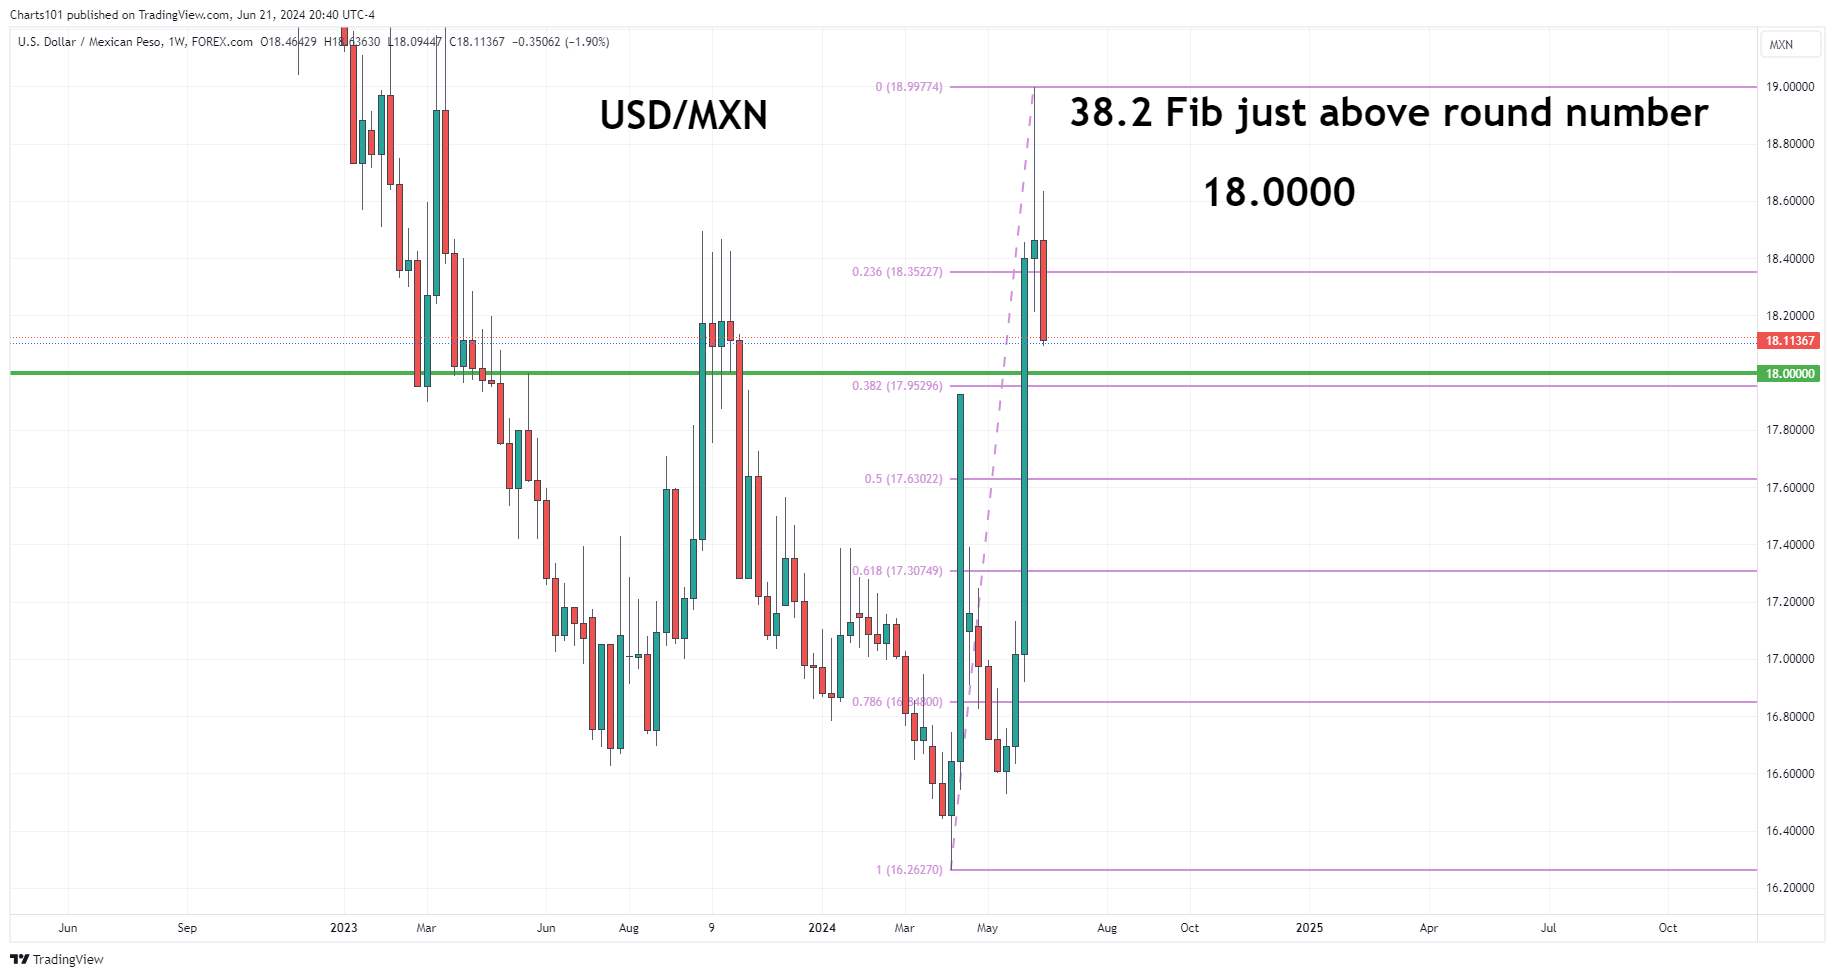
Weekly Chart – The week before last the pair moved 8+ %.
I’ll be keeping it on the radar for potential day and maybe swing trades.