EUR/USD – Short Trade

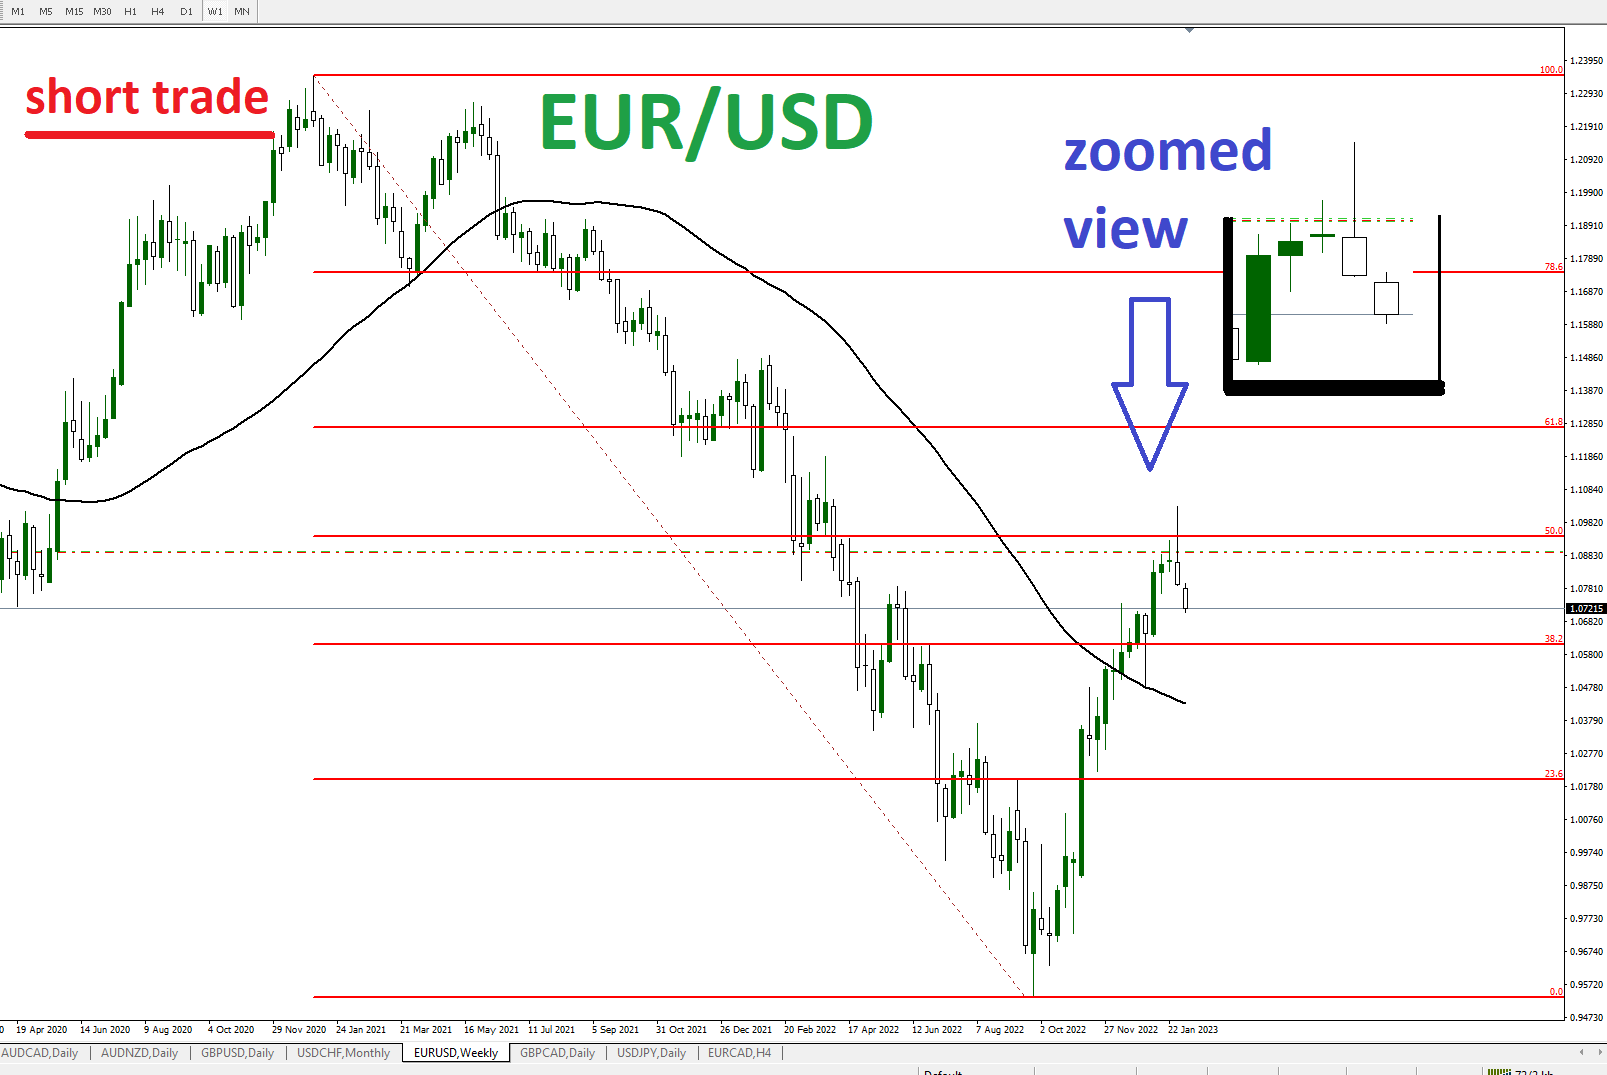
This is a weekly chart. The trade has a Breakeven Stop Loss in place.

We show a zoomed in portion of the chart to point out:

  • A Doji
  • The Bearish Candle that followed (last week)

The trade was not taken simply because of a candle pattern. However, it can be noted that the Doji and the candle that followed were in the area of a longer term 50% level and there is a Price Action observation worth pointing out.

The Bearish Candle Engulfed the Doji and closed near it’s lows after creating a tail that is longer than the body of the candle.

At the time of writing, price is about 120 pips above the 38.2 Fibonacci Level. That could be a potential target.

EUR/USD – Long Term Trade +770 PIPS

*Very Important Post*

This trade yielded about 770 PIPS. There were a few other gains and losses in this pair, and the position was stopped out this morning. It had been higher earlier in the week, and was up over 900 PIPS.

This wasn’t based on a system or signal service, it was a simple chart. It was a smaller sized position. However, here are a few simple points.

This trade lasted about 15 weeks. One standard Lot would equate to about $7,700. So even if you are not able to commit substantial time to actively trading, a part time – but serious- trader could have earned this in their side business.

It currently takes about $2,100 to open a standard lot of this pair. That is with 50:1 leverage as an example.

This is a Live Account. If you do not understand how to use leverage and choose a sensible position size, generally speaking you will not be able to hold a position like this.