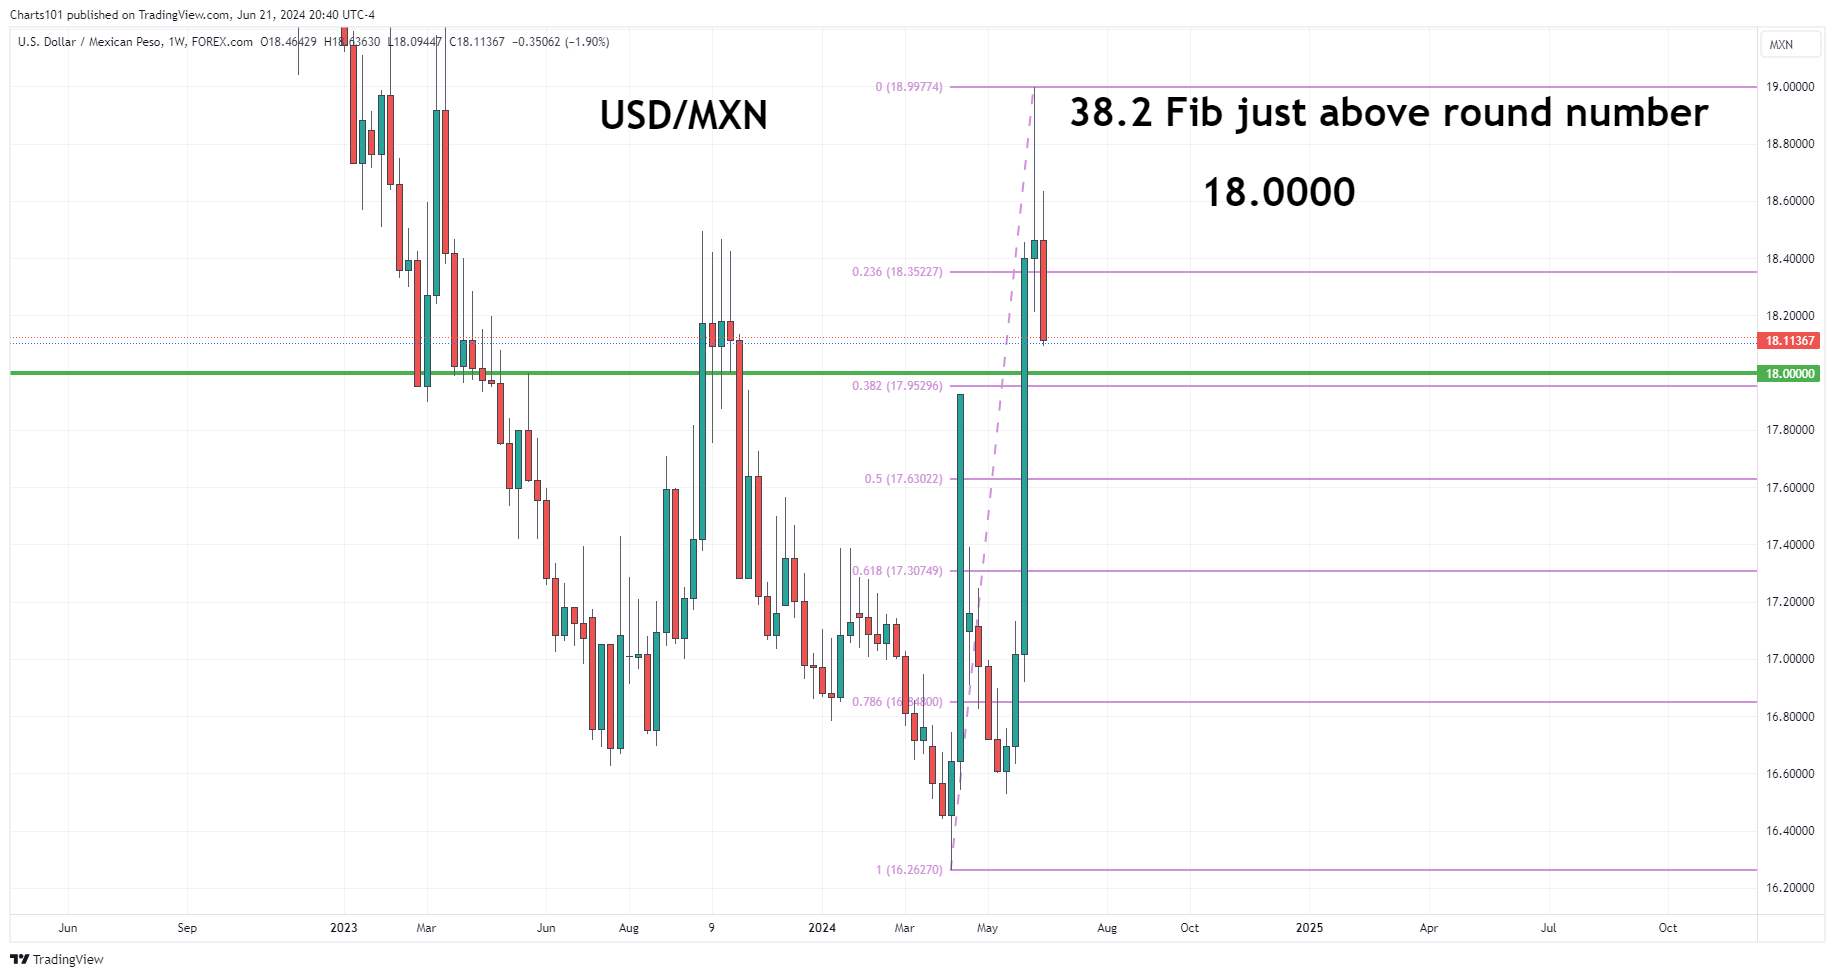
Weekly Chart – The week before last the pair moved 8+ %.
I’ll be keeping it on the radar for potential day and maybe swing trades.
Weekly Chart – The week before last the pair moved 8+ %.
I’ll be keeping it on the radar for potential day and maybe swing trades.
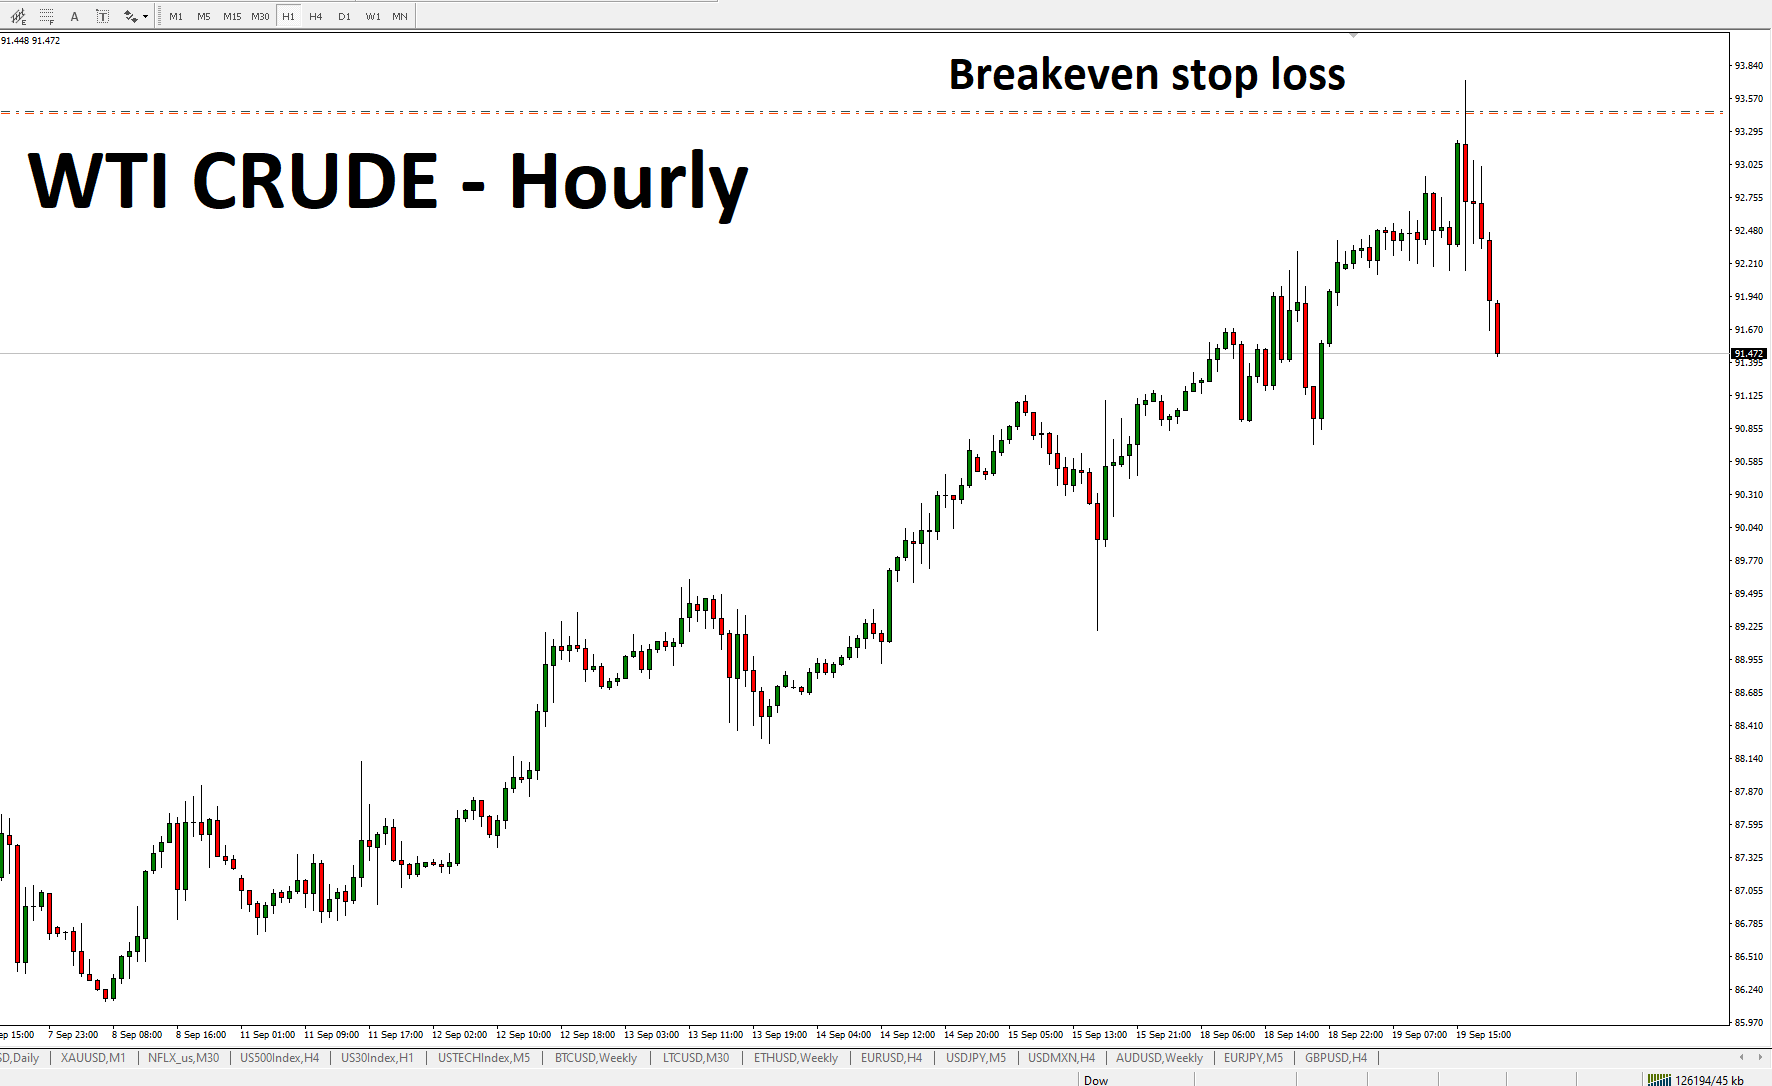
A Sell Limit order was filled at 93.46. Price is currently 91.60
Update:
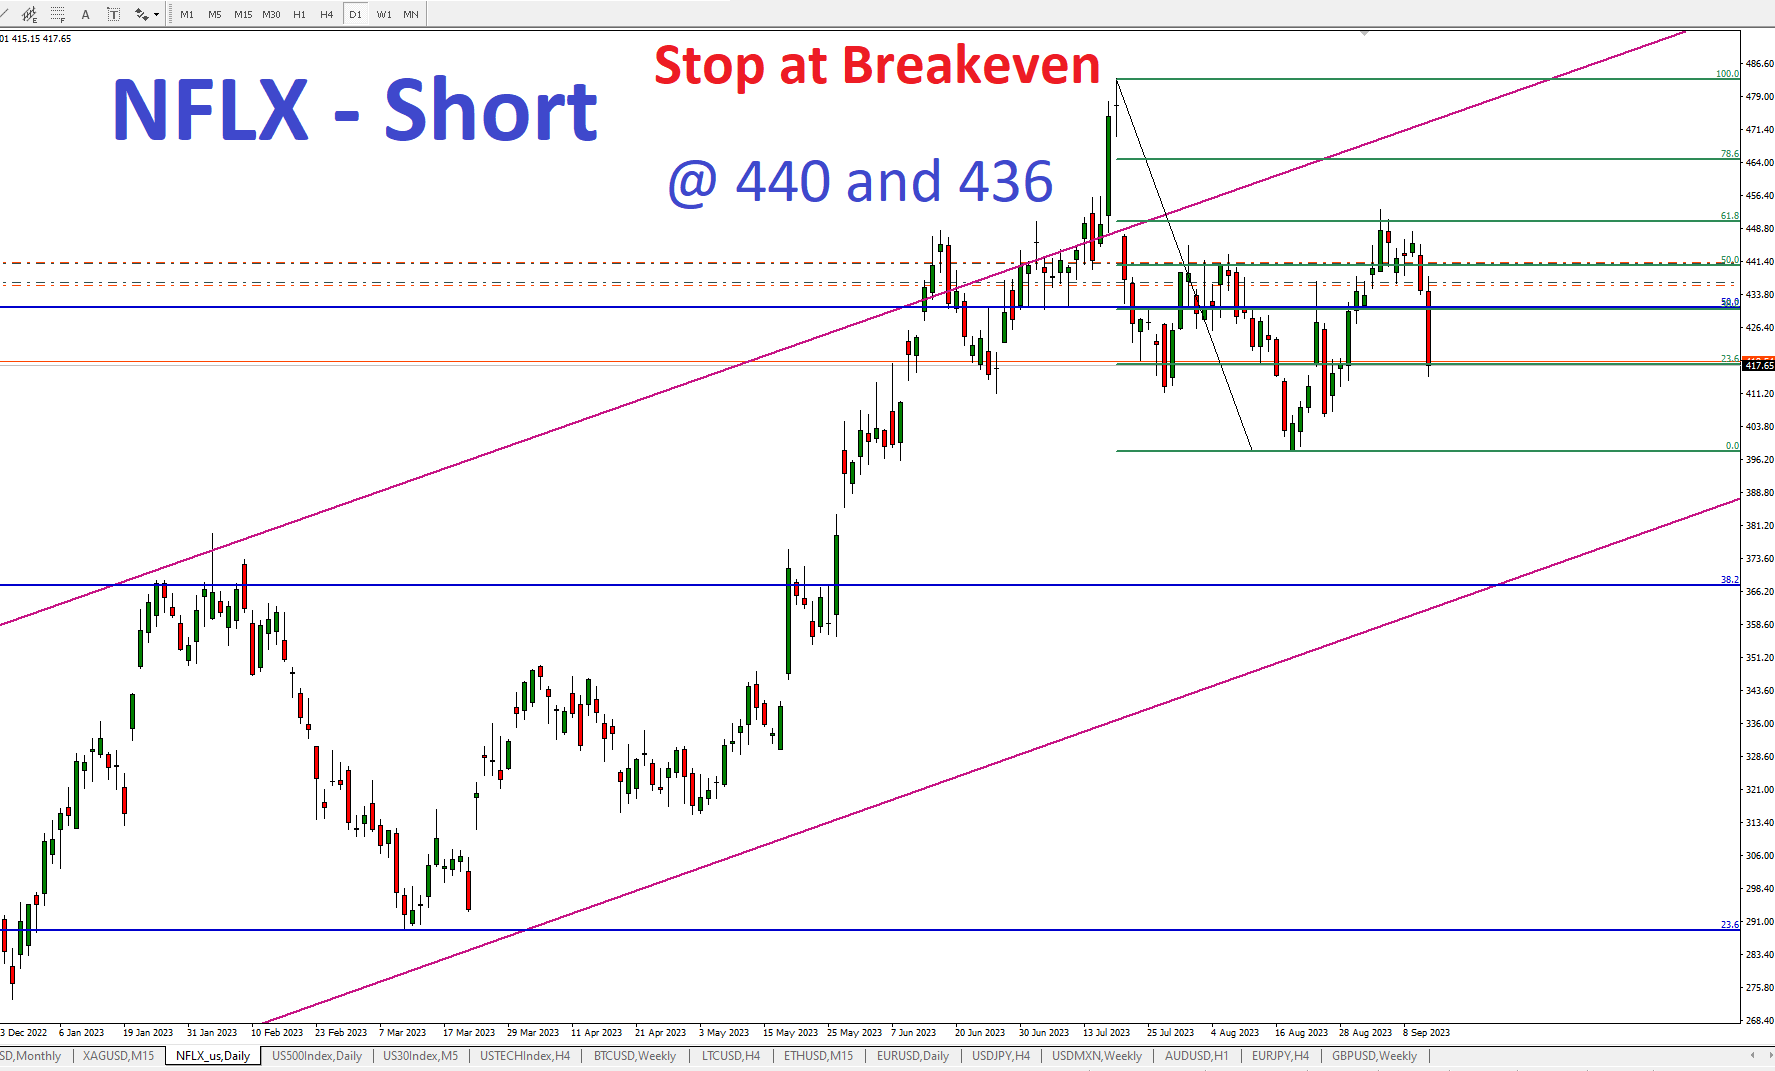
Price did move lower. It reached $401. We decided to exit around $406
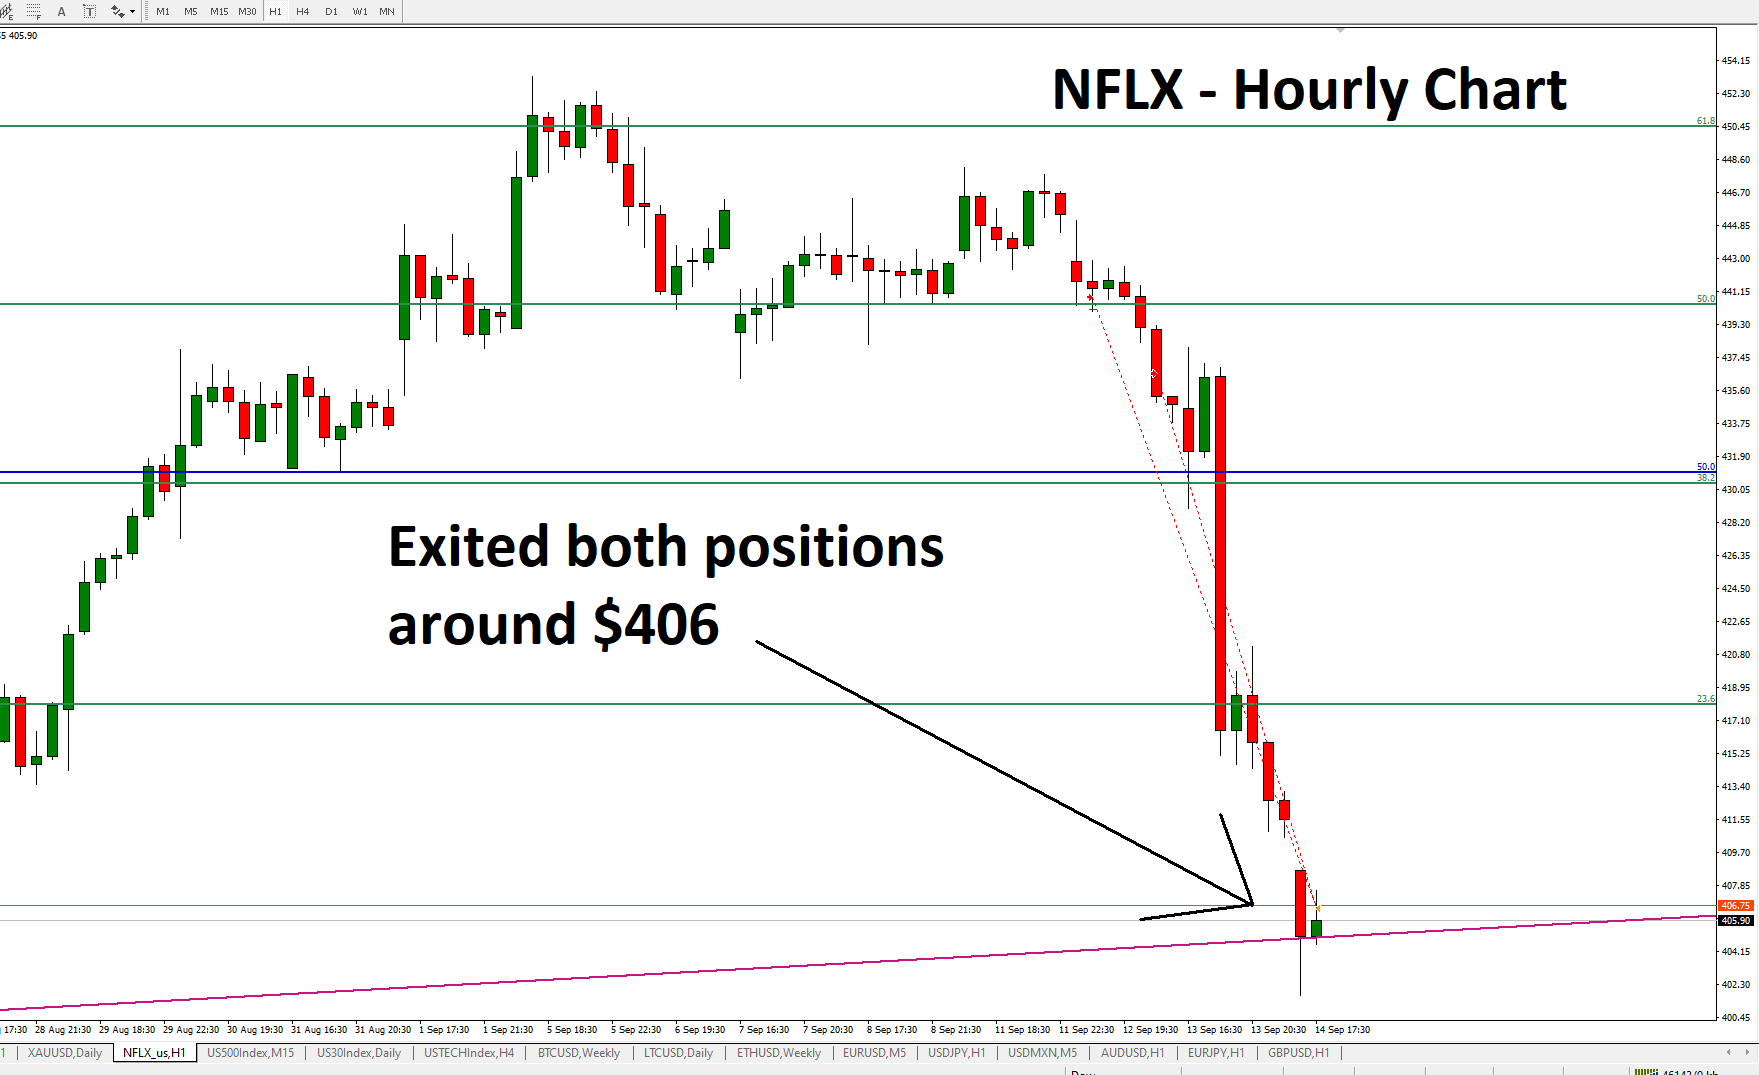
Let’s see if the shares can continue lower, towards the $400 level.