Litecoin Short Trade – $7 dollars profit per coin

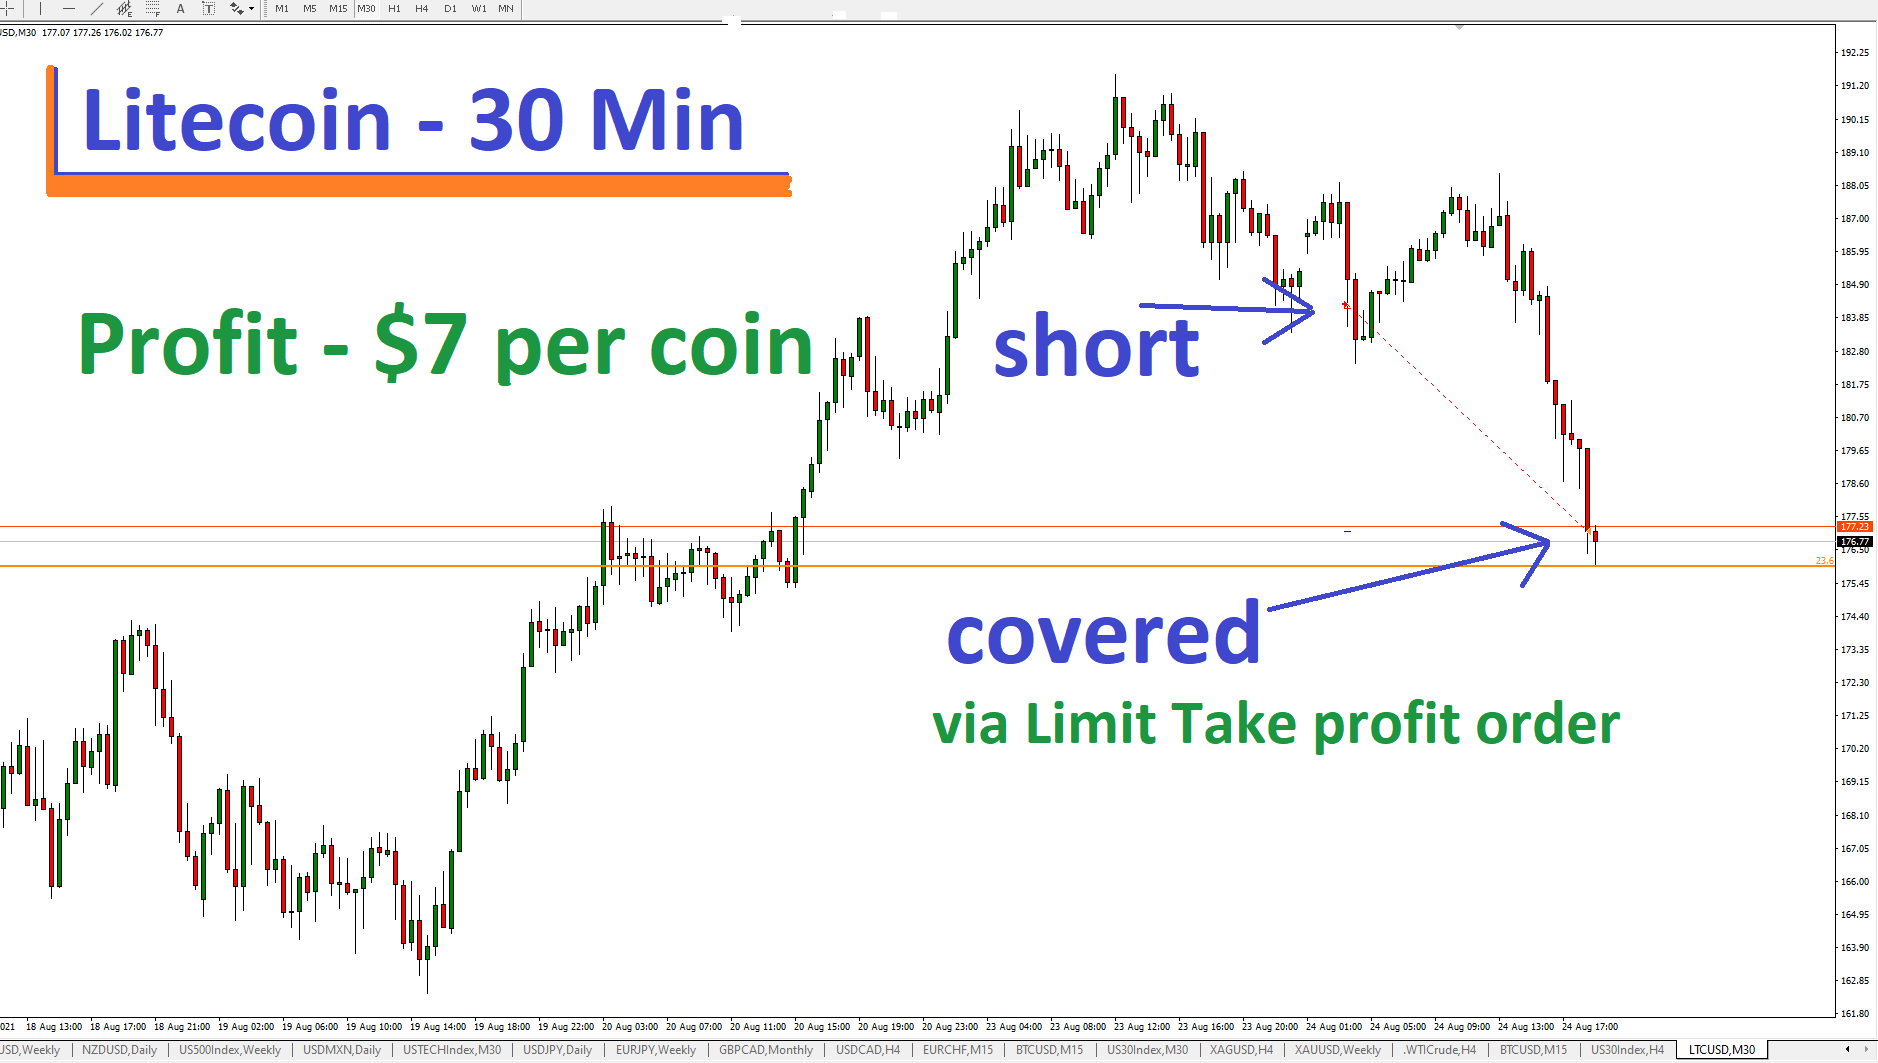
Here is a recent short trade on Litecoin, specifically LTC/USD. The first image shows the buy and sell levels and an orange line which is a Fibonacci level.

The price moved above that 23.6 level. We can see the price moving up to the level, consolidating around it, and moving higher.

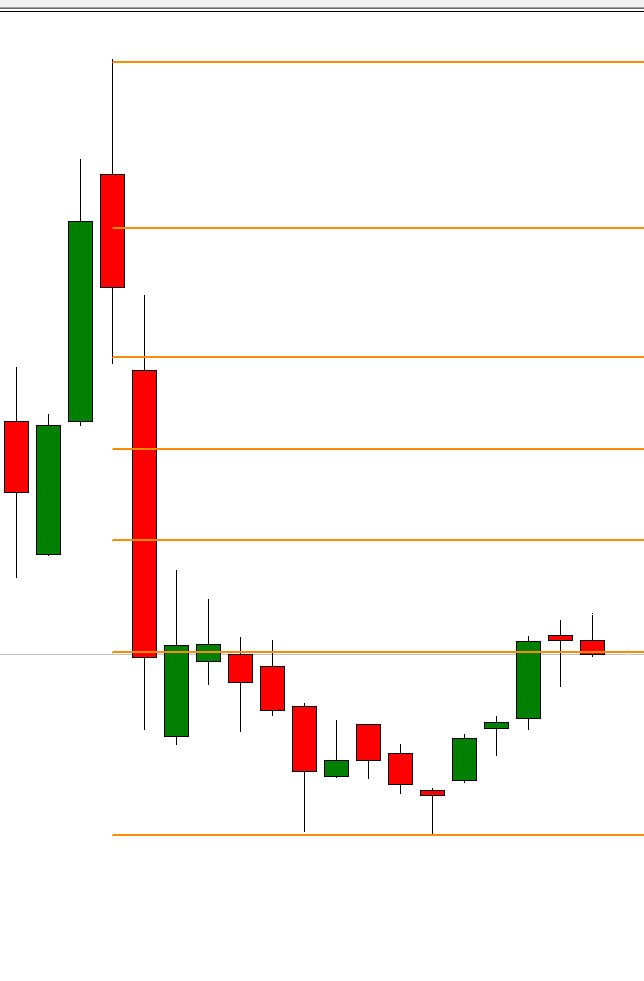
The second image shows where the Fibonacci levels were drawn on a weekly chart

You might say that the price wanted to come down to test that level after moving through it to the upside.

Dow short trade – 1 Minute Chart – Early U.S. Session

This trade yielded 189 points. There was a Fibonacci retracement drawn on a longer term time frame.

A short position was taken in anticipation of a trend line break. As happens frequently, price pushed higher after the trendline break, resulting in some sort of false breakout.

At a certain point while the trade was on, I placed a breakeven stop loss. Then I moved it to about +30 points. Then I exited manually. If you zoom out to a 5 minute chart, you’ll notice that price bounced around the area where there was a prior swing high.