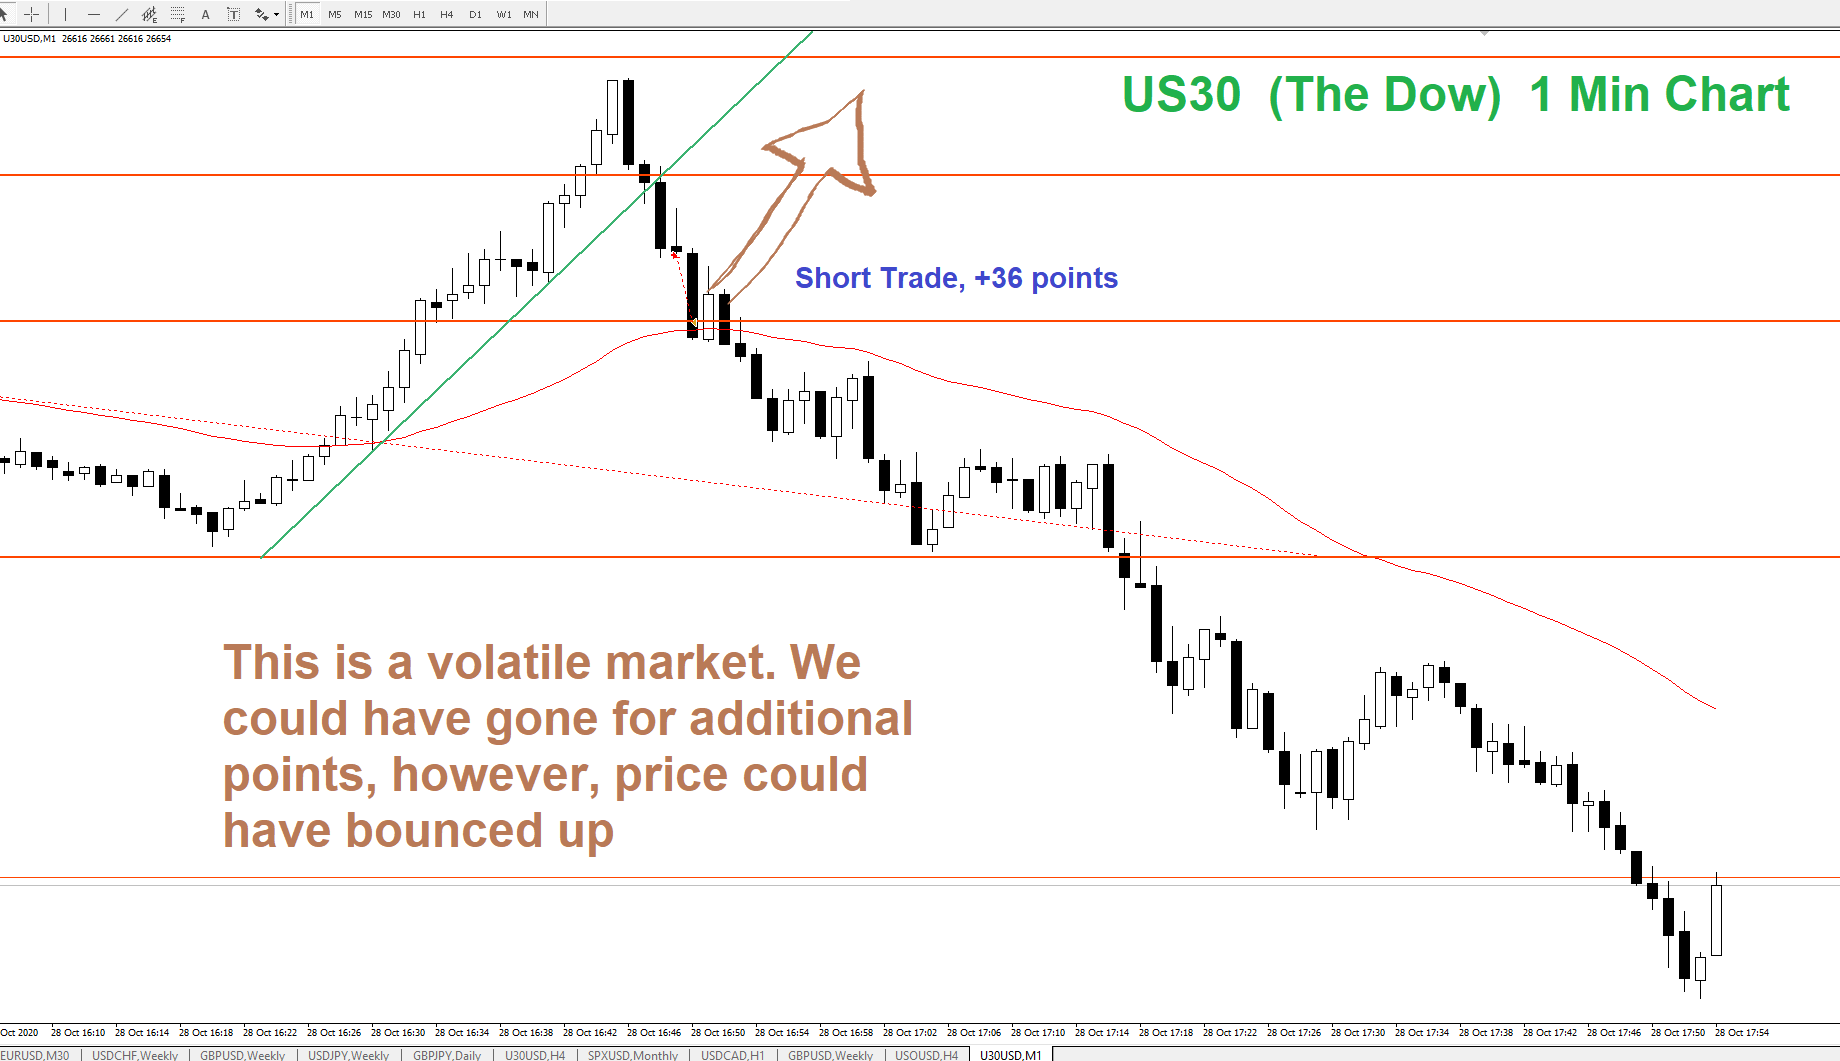
1 Minute Chart
This trade was good for 36 points. The markets have been volatile.
Look closely at the entry. It appears that after the (green) trendline break, there was an attempt to retest the area, then selling took over
1 Minute Chart
This trade was good for 36 points. The markets have been volatile.
Look closely at the entry. It appears that after the (green) trendline break, there was an attempt to retest the area, then selling took over
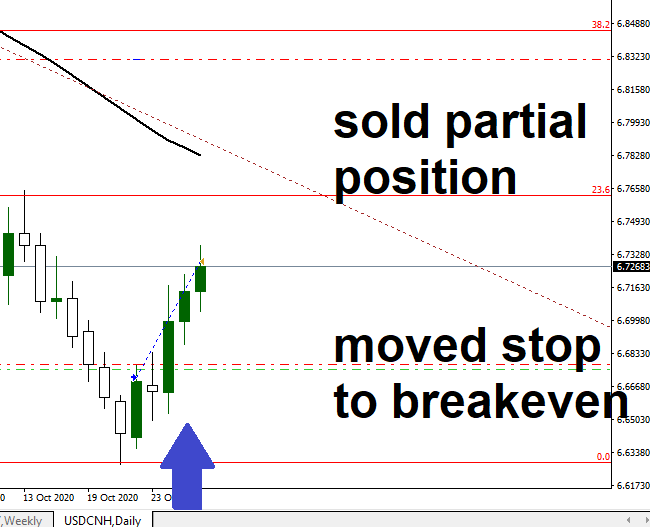
The USD rallied against the Yuan.
What I did was sell part of the position. I still have a long position with a stop loss at breakeven.
I will monitor and decide when to exit
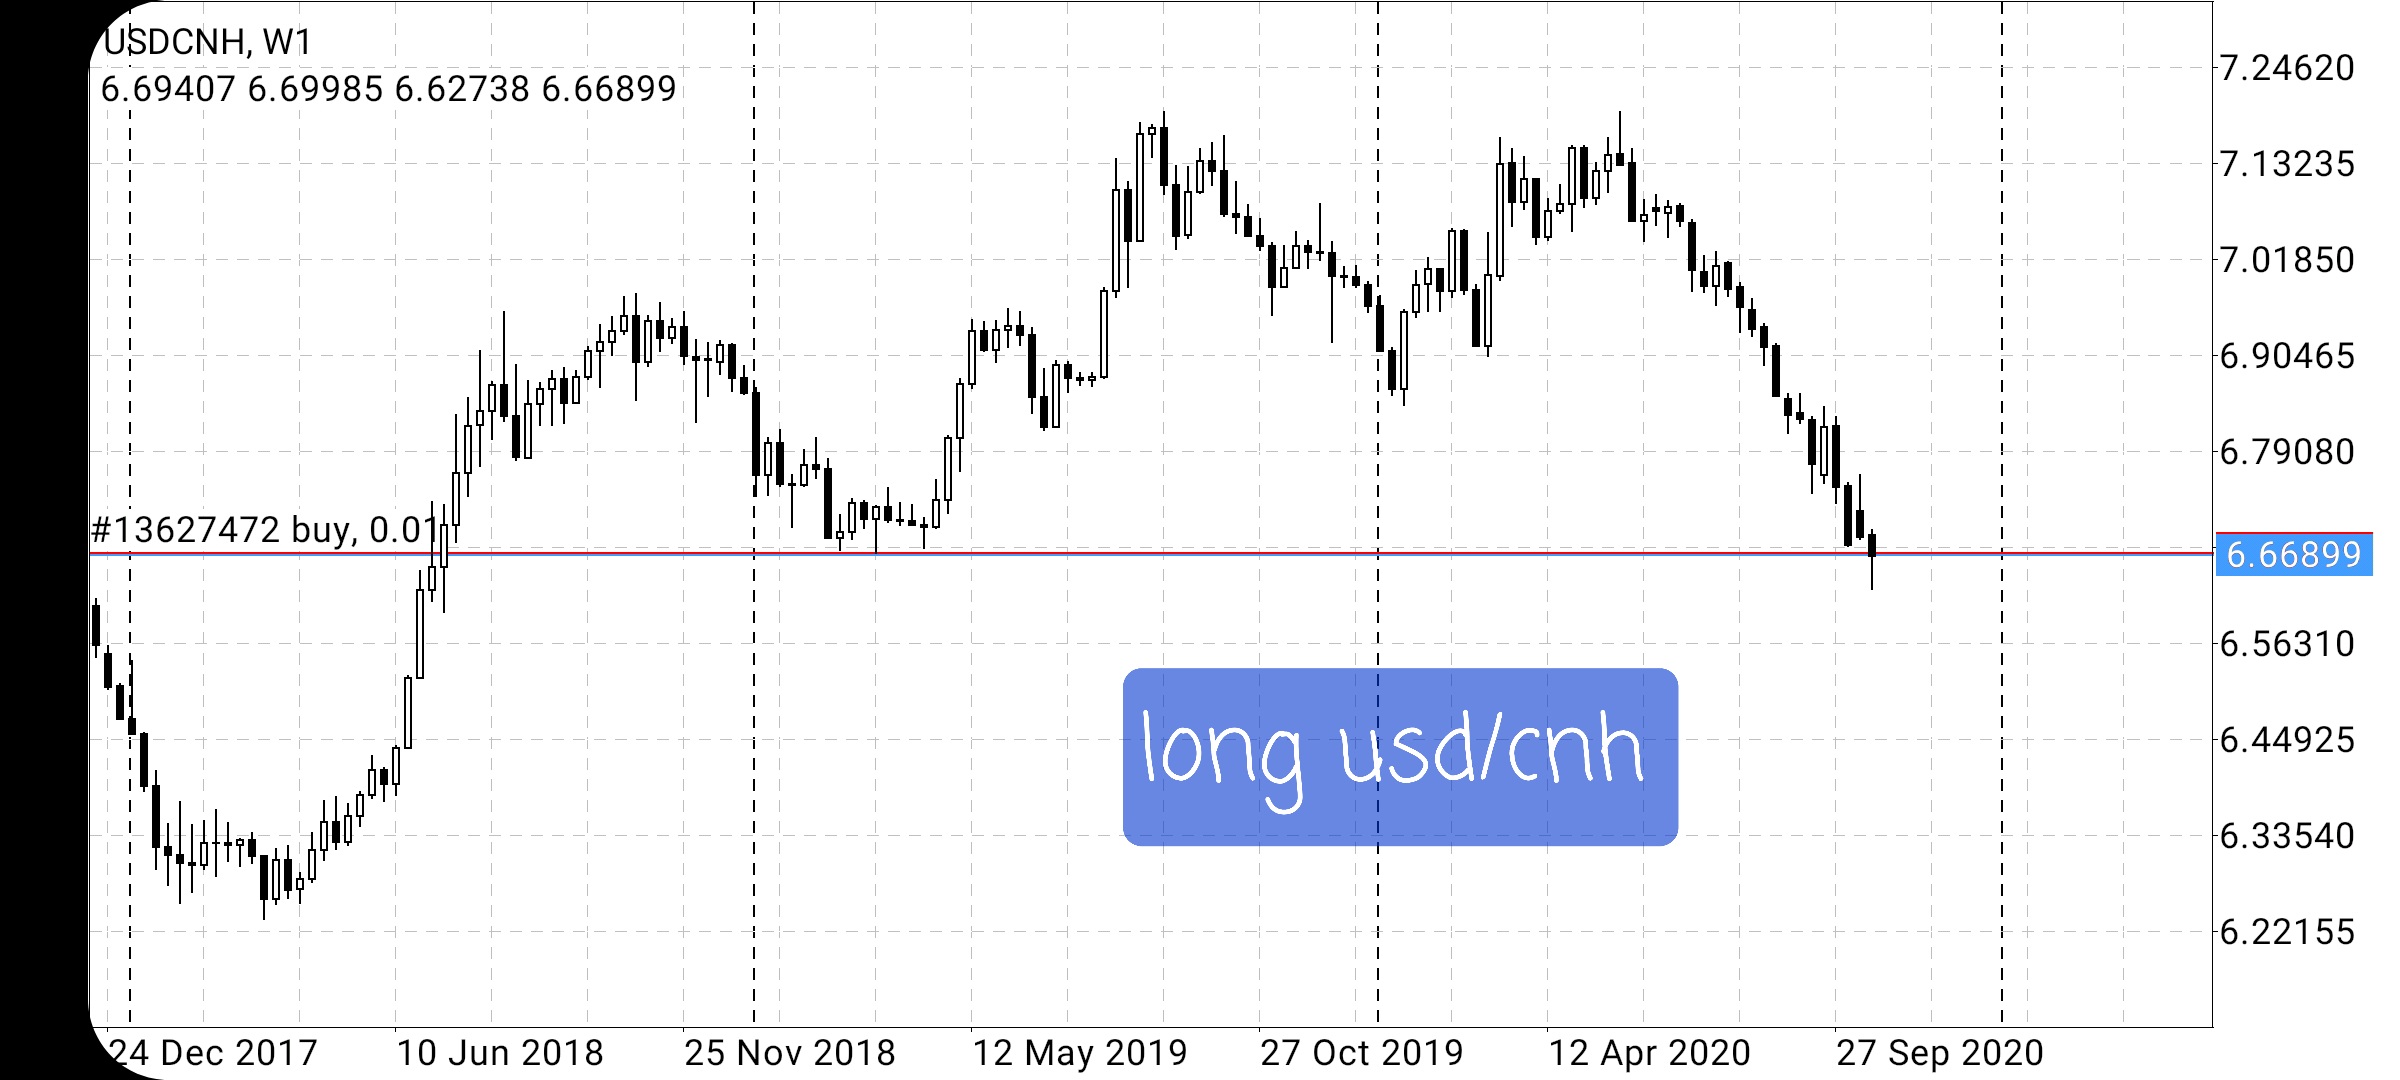
This is an example of a trade based on a long term chart.
We are basically looking for some kind of bounce; and since it is a very small size I am not too concerned if it doesn’t start working right away.
Recently, I took a trade on usd/chf and it moved lower, I bought more and ended up with profits 📈 .
You cannot trade like this if you are overleveraged, period, end of story.
Let’s track what happens with this trade
Since the web page is getting some traffic I am aiming to beef up the info in my posts, I appreciate every visitor,
Don’t hesitate to ask me to speak to something of specific interest