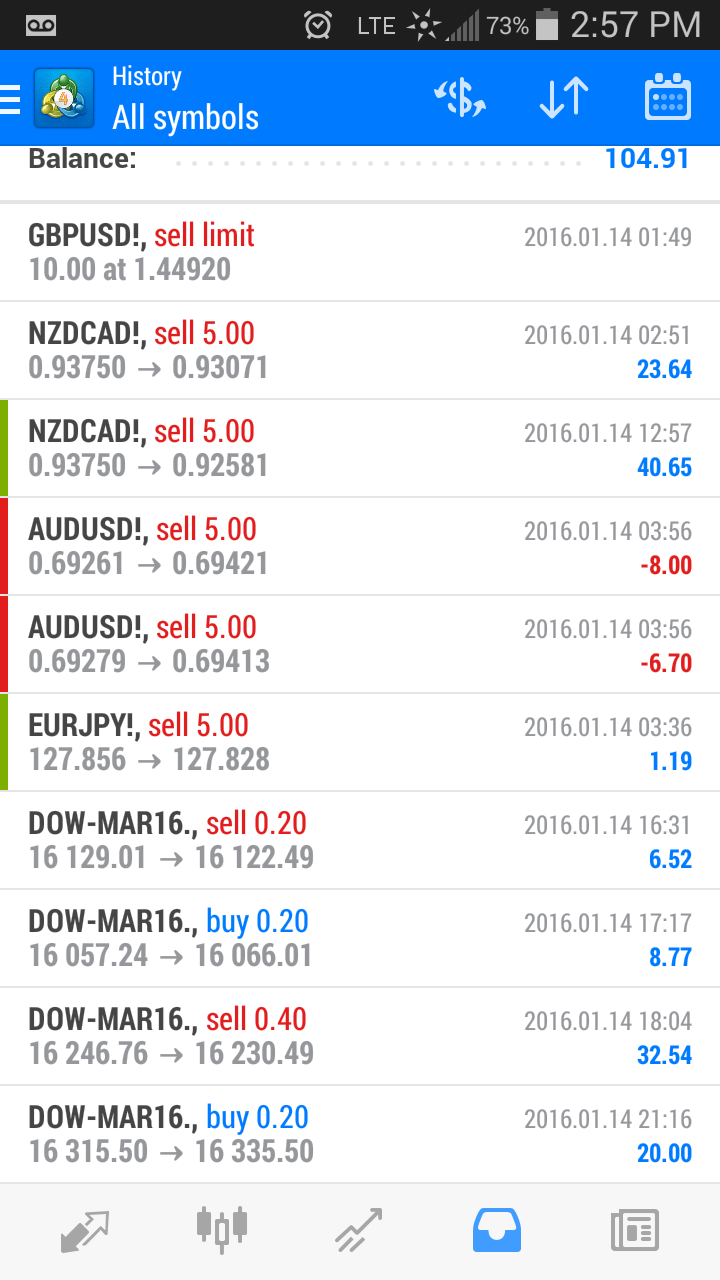
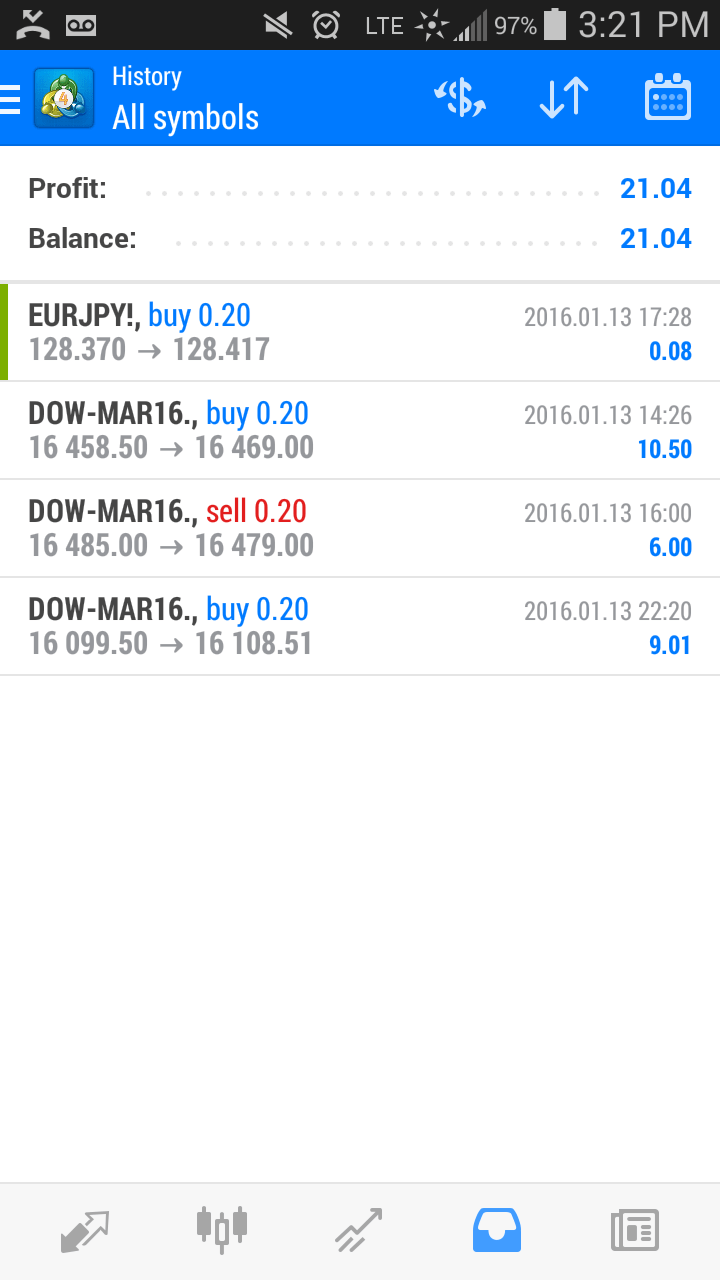
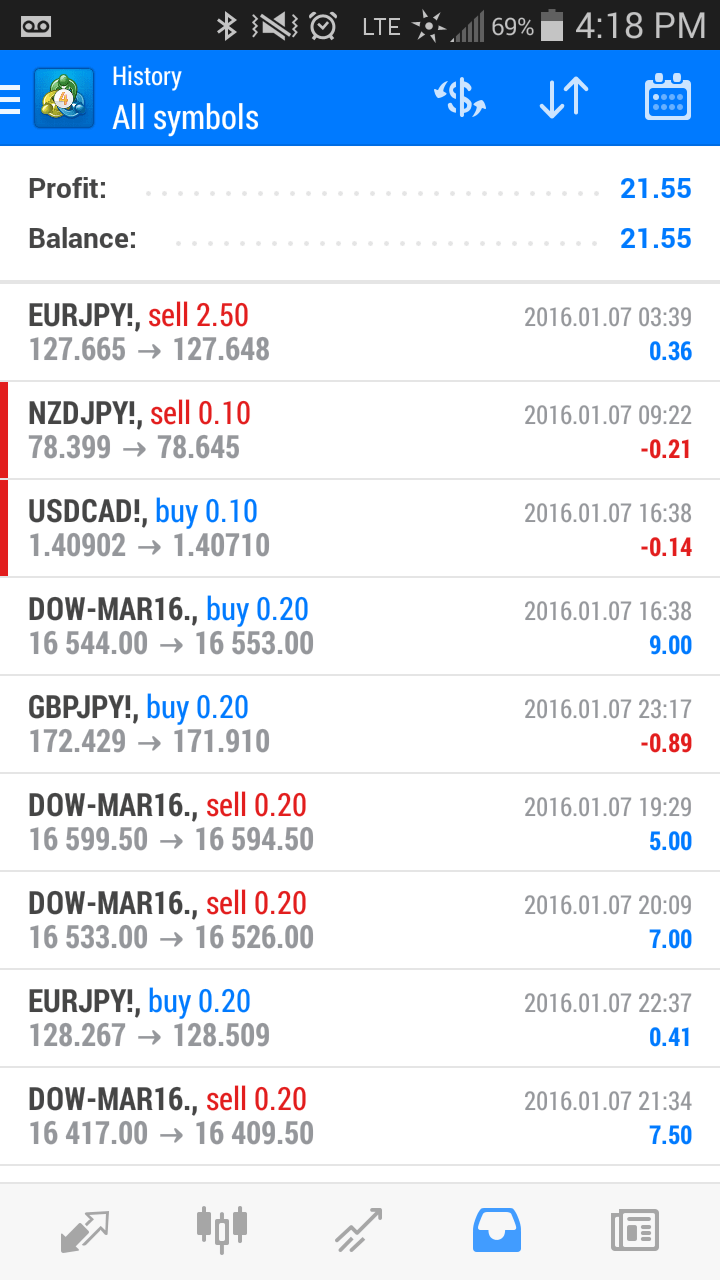
This sample shows several quick DOW index trades, and couple of overnight FOREX trades (NZD/CAD) which helped performance for the week – there were losses earlier in the week not shown here. The point is some days we can put out performance – like the 4 DOW trades below – and get those $60 plus scalping sessions up to $120, and then $300, etc..
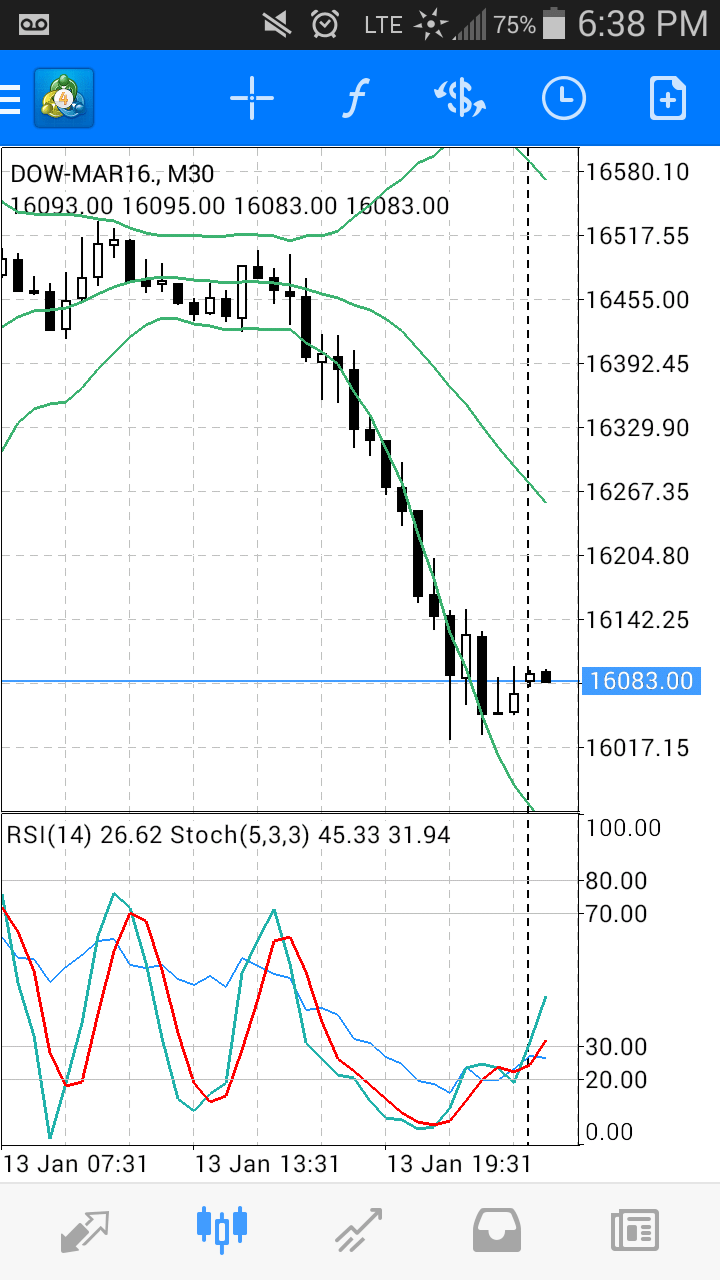
One goal is to use a simple chart template to do this (see previous post)