Using Bollinger Bands for short term trading

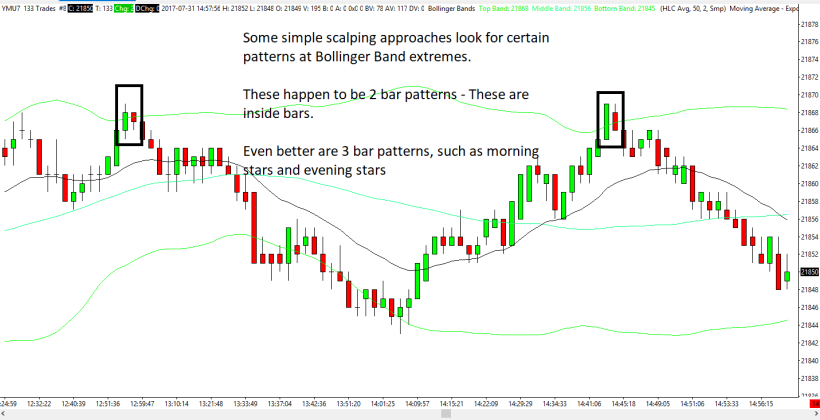
This is not a complete explanation of a trading approach, however it is useful to see how these moves play out.

These particular moves played out nicely.

This chart only has a 50 period Bollinger Band and a 20 period Moving Average

Notice after the second pattern, after the move to the middle band, there were 3 equal bottoms. When they broke, price actually moved past the lower band (not shown on chart)


Capture

BTC/USD – Buy Stop


This gap was filled. I don’t think I even appreciated this reverse head & shoulders shown below the arrow.

Interesting (to me) note: I had a Buy Stop at 2100.00 and was filled at 2100.02

I don’t trade this regularly however I like that it’s available as a CFD or whatever it is.

There are big changes happening with Bitcoin so I wouldn’t recommend trading for a while, or at least not holding it.


btcusd-m15-fx-choice-limited