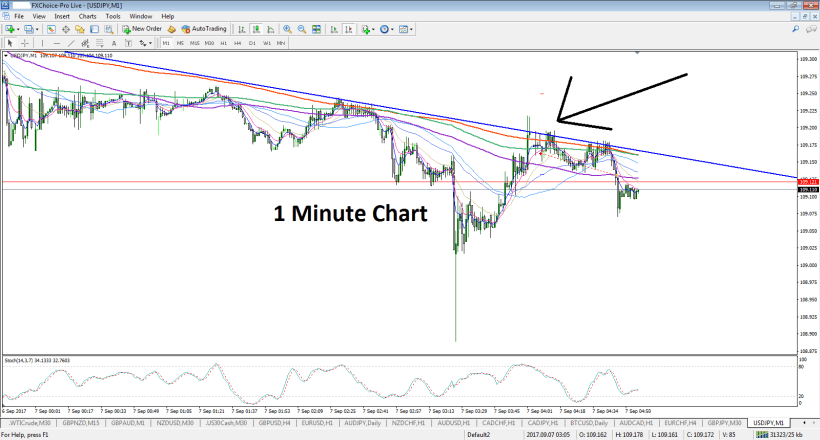
Here’s a scalp for a few PIPS. The second chart is the one minute. I did notice the gap.
There were a few more PIPS available

Here’s a scalp for a few PIPS. The second chart is the one minute. I did notice the gap.
There were a few more PIPS available
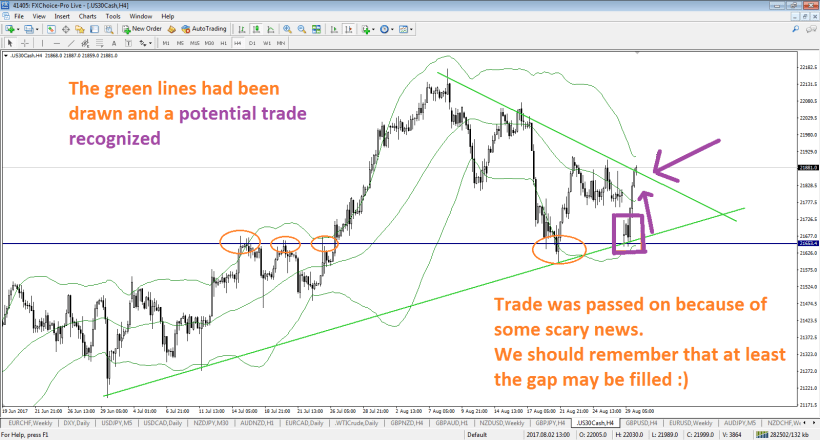
Some simple drawing was done with some nice support identified.
At the time I was looking at the chart it had gapped down to a potentially confluent area.
Due to some troubling news I thought of this as a gamble and declined to set up a trade. It turned out it would have moved nicely in my favor.
Do you see the potentially confluent area? Any other comments?
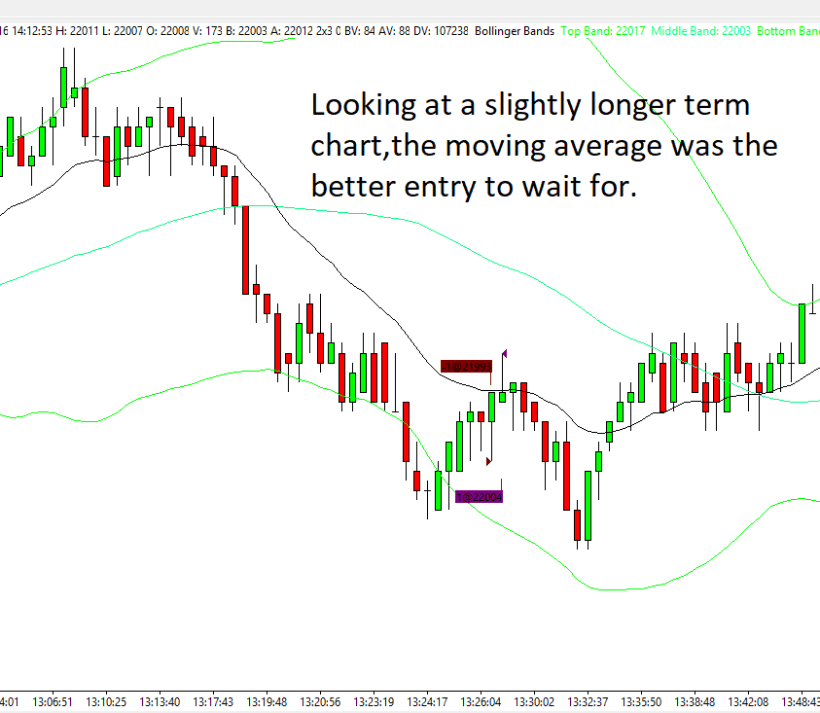
The last post mentioned 2 and 3 bar patterns.
This SHORT trade is an example of a decent idea but some haste when it came to pulling the trigger. Holding out for some kind of bar or candle formation would have helped. We see that there were inside bars, bars with equal highs and lows, and even a pin bar right at a moving average.
Do you see them?
I won’t mention what instrument this is or what the time frames are. Just focus on price action.