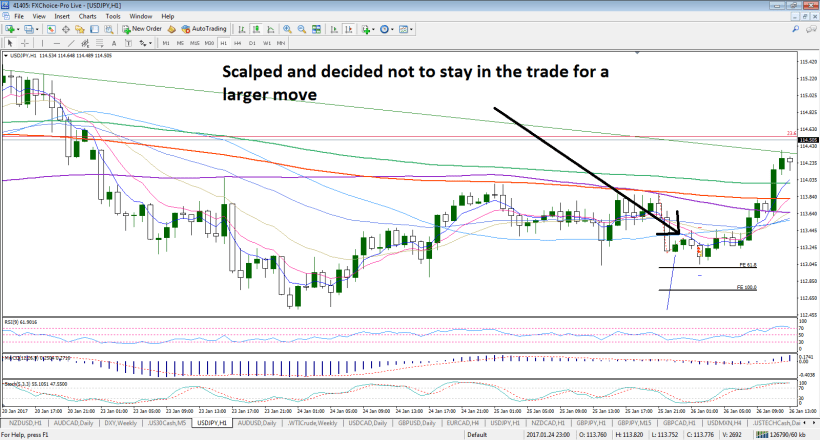
I found this interesting as we have a Trendline and a 61.8 Fibonacci level

I found this interesting as we have a Trendline and a 61.8 Fibonacci level
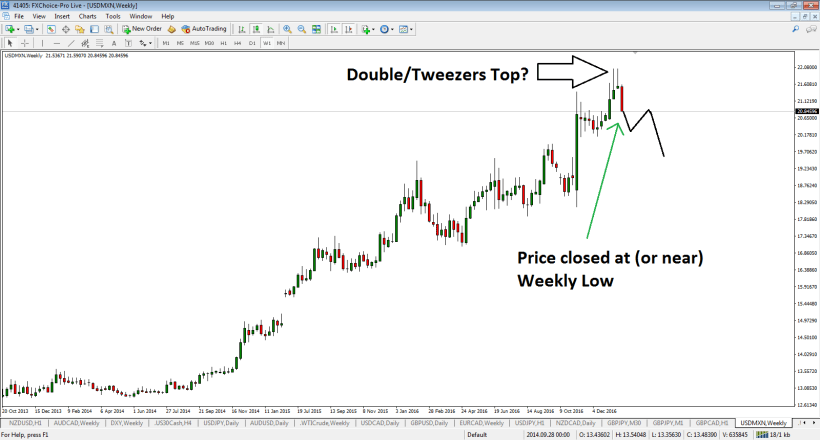
This is a long term (Weekly) chart of US Dollar vs. Mexican Peso. We wouldn’t try to call a top in this pair. There is a lot going on from an Economic and Political perspective. However, there are some observations worth noting.
We have a Tweezers Top, Evening star pattern, a very weak close. Just for fun, we can draw a potential head and shoulders formation.
Can this shoot higher for the next month or two? YES.
But, we can start with an idea and see how it starts playing out.
I was planning a short trade yesterday, keeping in mind there was Employment data being released today.
I had a scalp trade (short), and put on another one. I exited the 2nd one as well.
My decision to not put another short on for a larger move wasn’t based on much, other than simply not wanting to put on a 3rd trade on the pair.
As it turned out, the price moved up.