More on short term trading


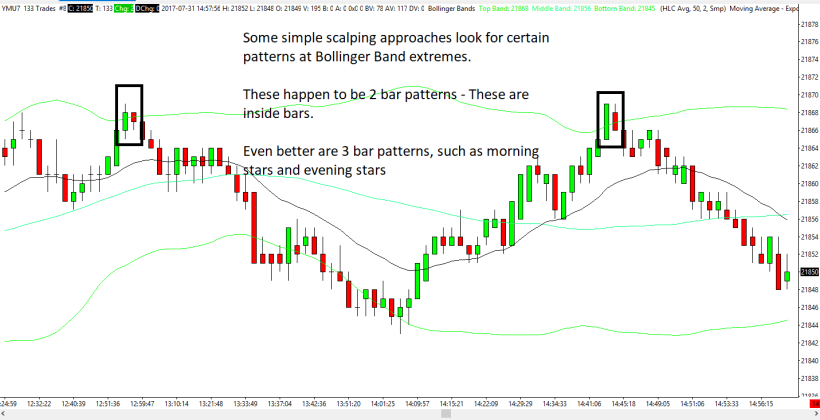
The last post mentioned 2 and 3 bar patterns.

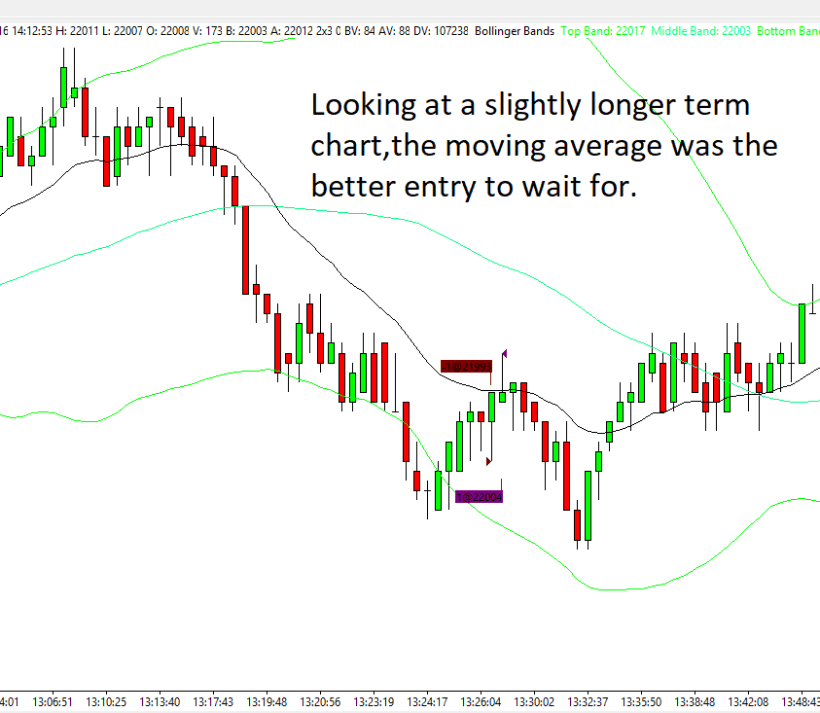
This SHORT trade is an example of a decent idea but some haste when it came to pulling the trigger. Holding out for some kind of bar or candle formation would have helped.  We see that there were inside bars, bars with equal highs and lows, and even a pin bar right at a moving average.

Do you see them?


I won’t mention what instrument this is or what the time frames are. Just focus on price action.


ym70816


ym133816

Using Bollinger Bands for short term trading

This is not a complete explanation of a trading approach, however it is useful to see how these moves play out.

These particular moves played out nicely.

This chart only has a 50 period Bollinger Band and a 20 period Moving Average

Notice after the second pattern, after the move to the middle band, there were 3 equal bottoms. When they broke, price actually moved past the lower band (not shown on chart)


Capture

BTC/USD – Buy Stop


This gap was filled. I don’t think I even appreciated this reverse head & shoulders shown below the arrow.

Interesting (to me) note: I had a Buy Stop at 2100.00 and was filled at 2100.02

I don’t trade this regularly however I like that it’s available as a CFD or whatever it is.

There are big changes happening with Bitcoin so I wouldn’t recommend trading for a while, or at least not holding it.


btcusd-m15-fx-choice-limited