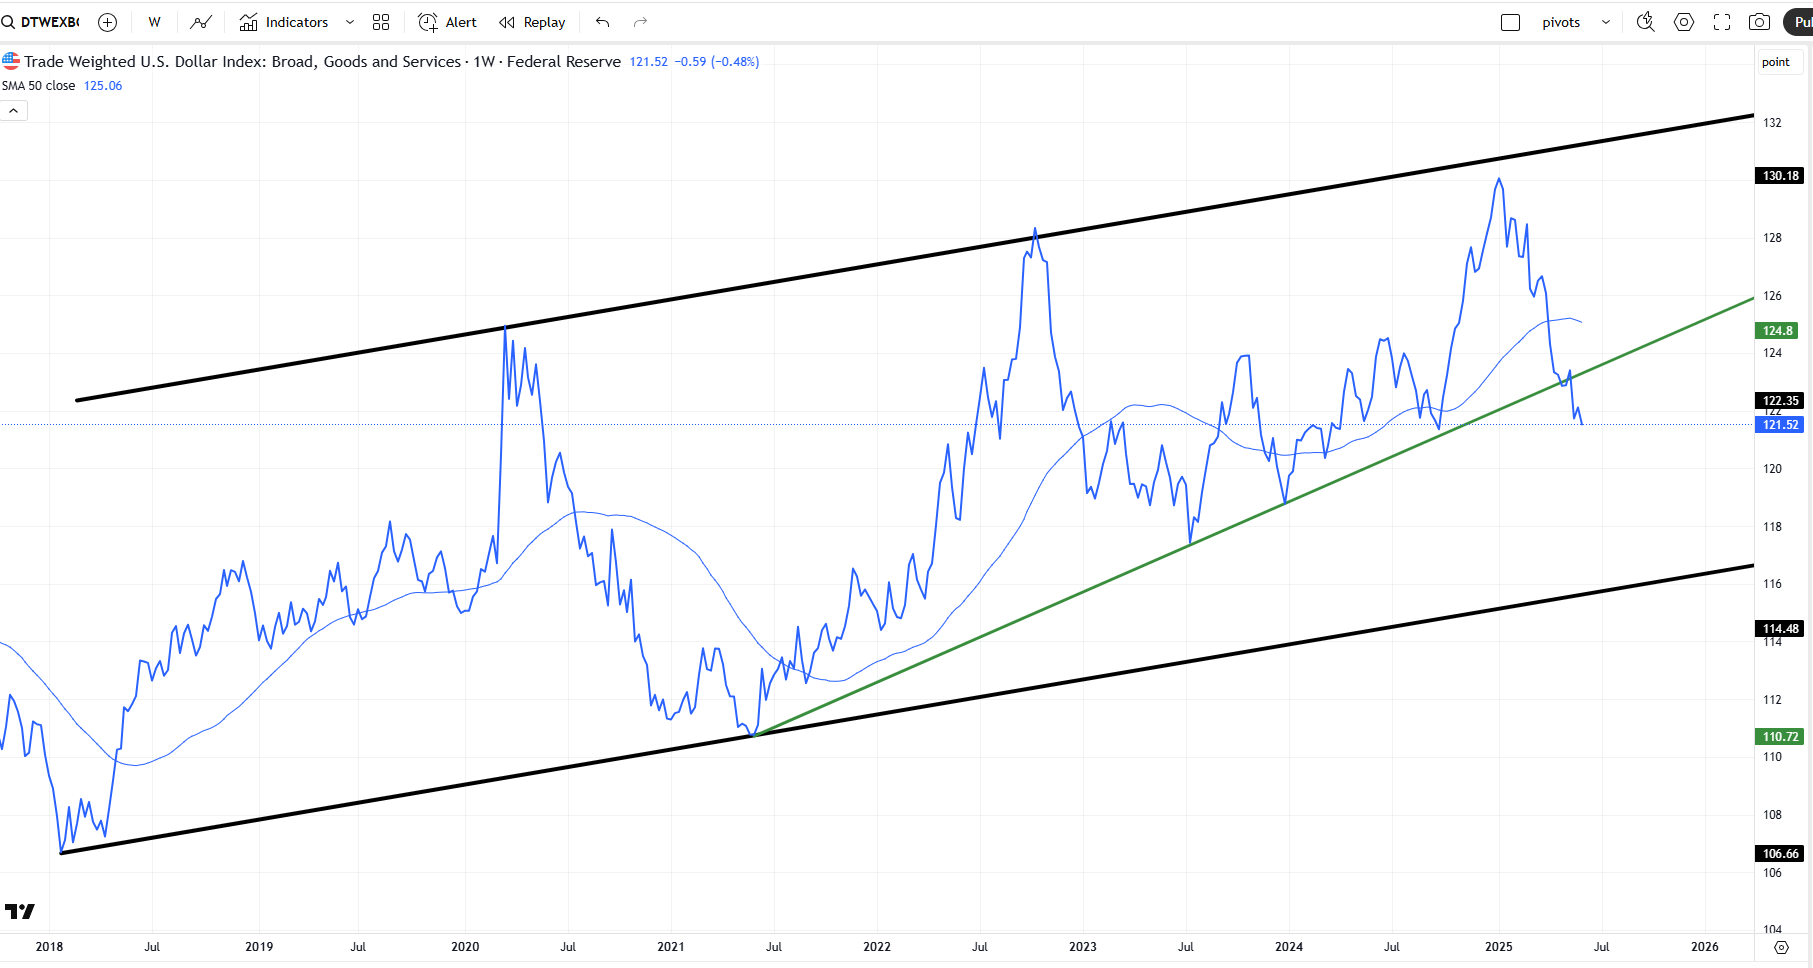
Ticker DTWEXBGS gives us a different Dollar Index.
The beginning of this year made a new high, taking out the high from October 2022.
A few weeks have closed below the trendline. Anyway, its good to know about this index.
Ticker DTWEXBGS gives us a different Dollar Index.
The beginning of this year made a new high, taking out the high from October 2022.
A few weeks have closed below the trendline. Anyway, its good to know about this index.
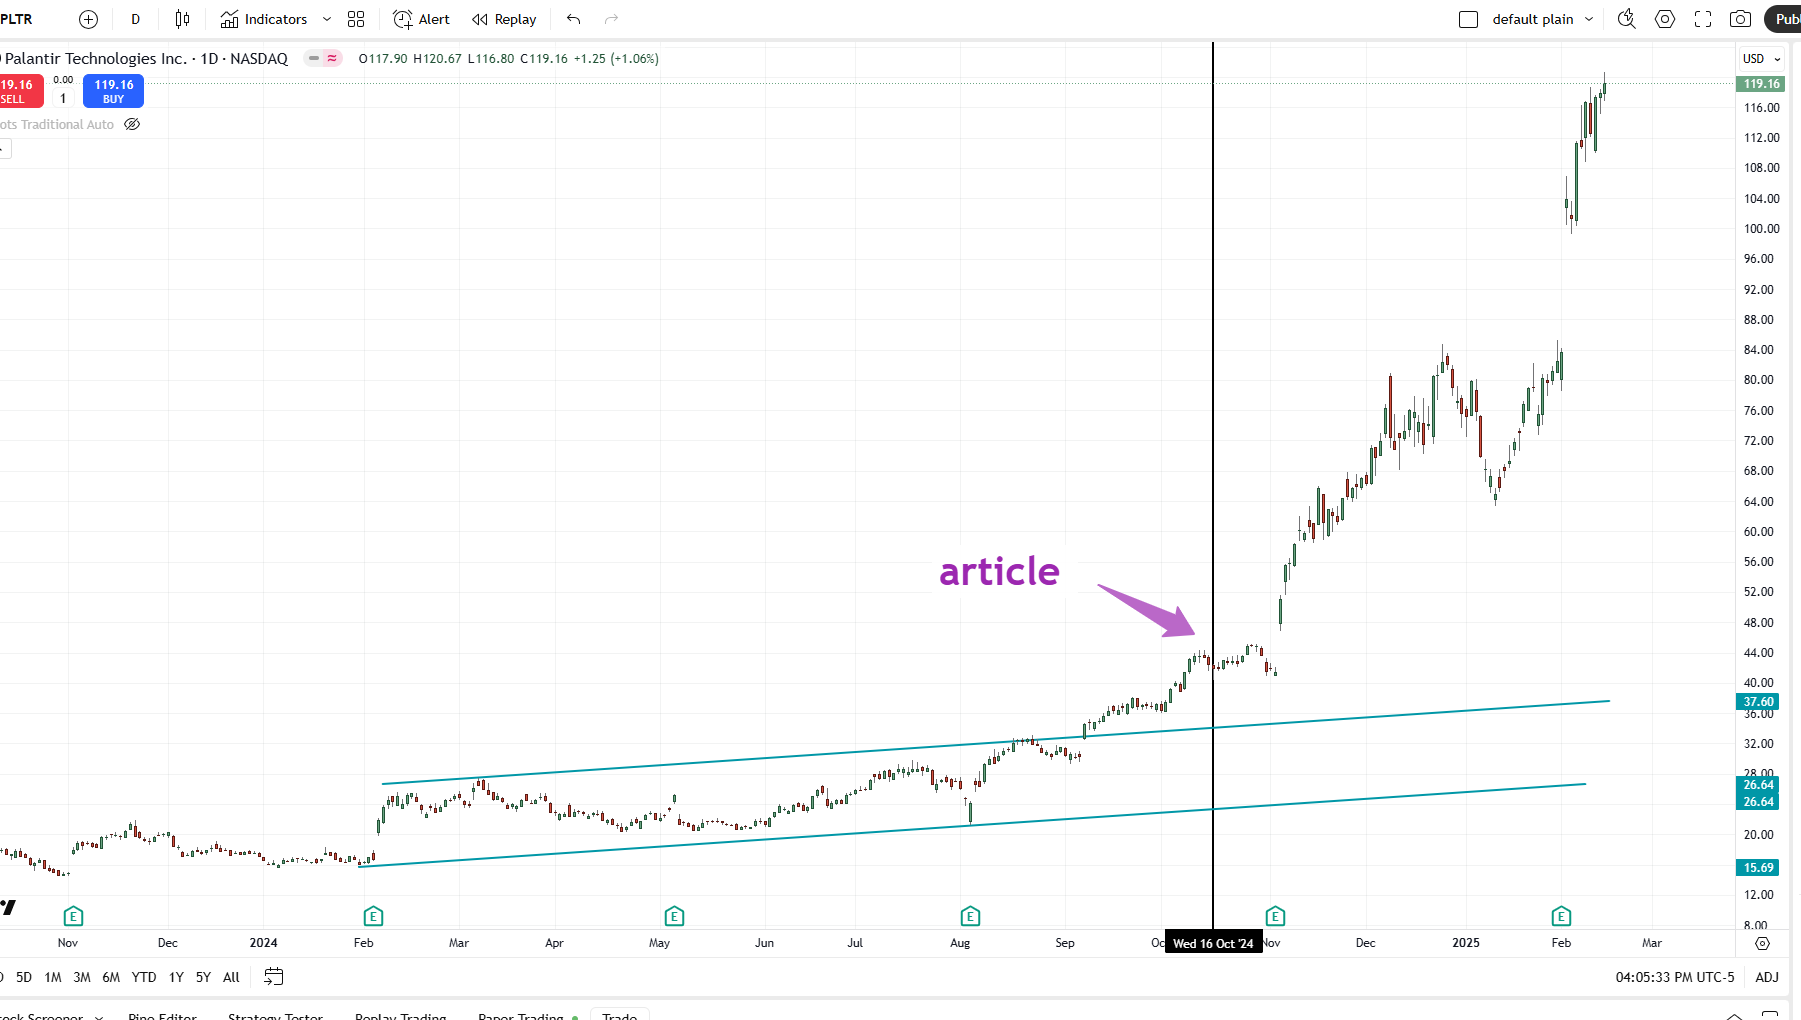
This fairly critical article came out shortly before the stock went parabolic. It had strong bulling price action on this long term daily chart.
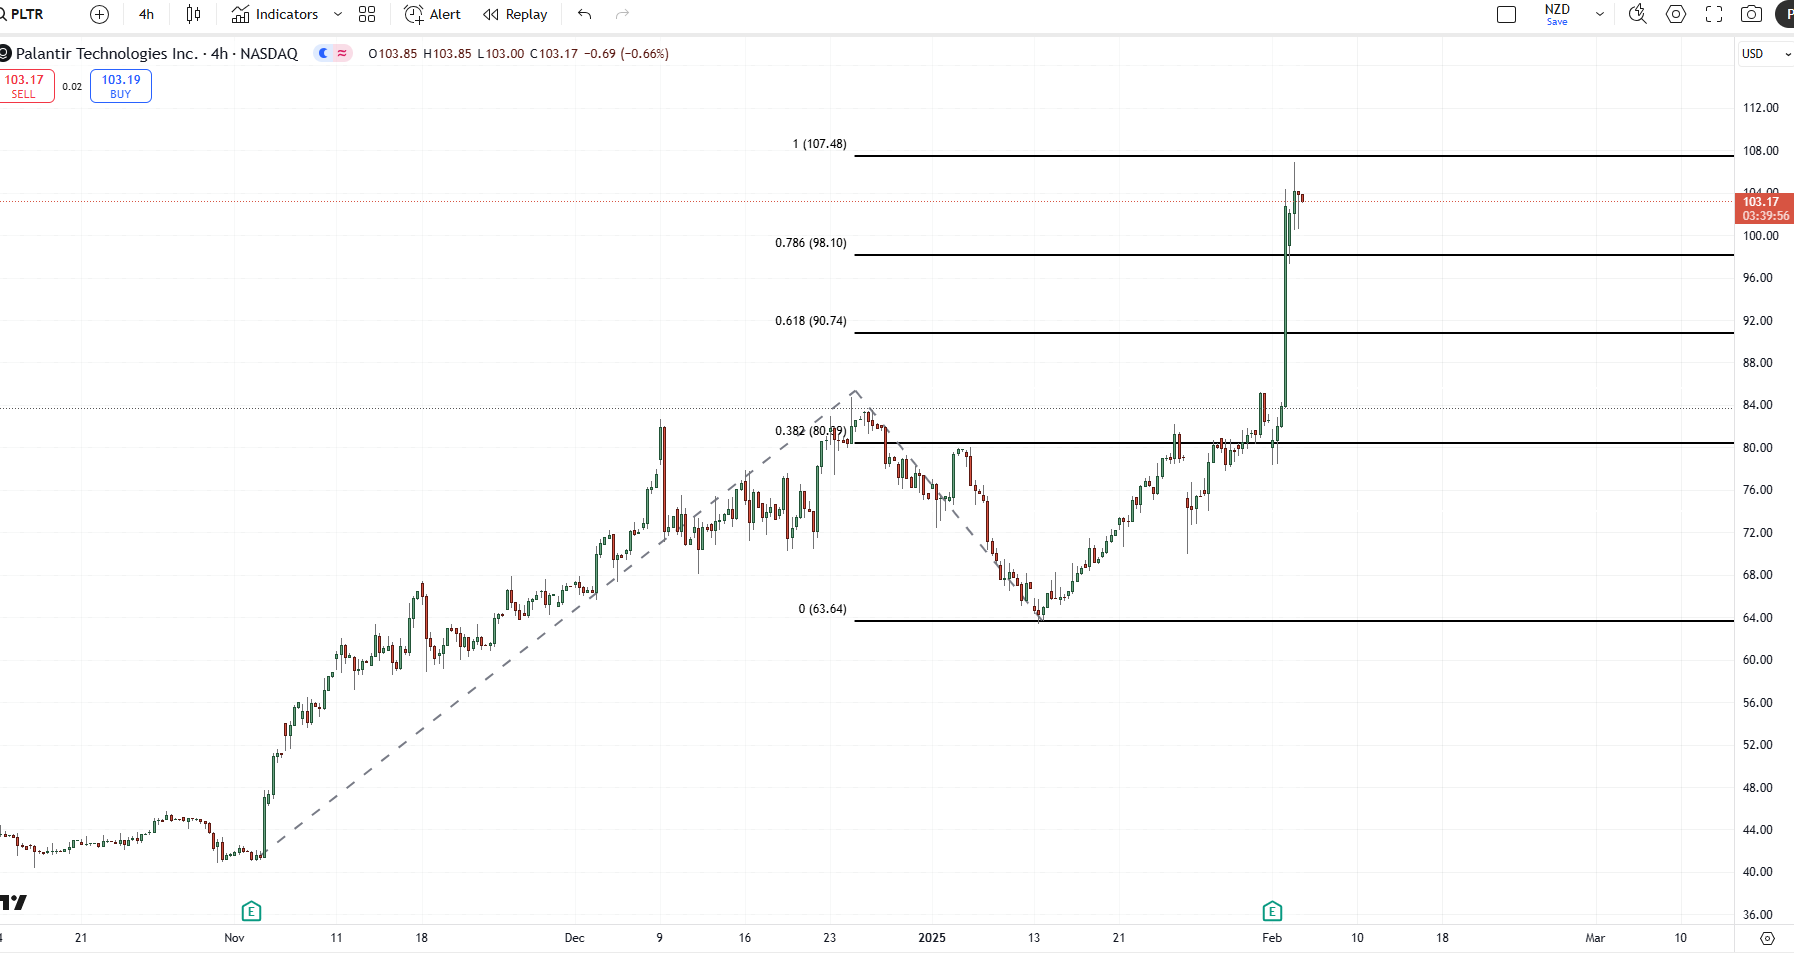
The stock moved to the top of that Fib expansion that was drawn. Lets see how it behaves around that 100 level.