EUR/CAD – short trade 4 HR chart – stop at breakeven

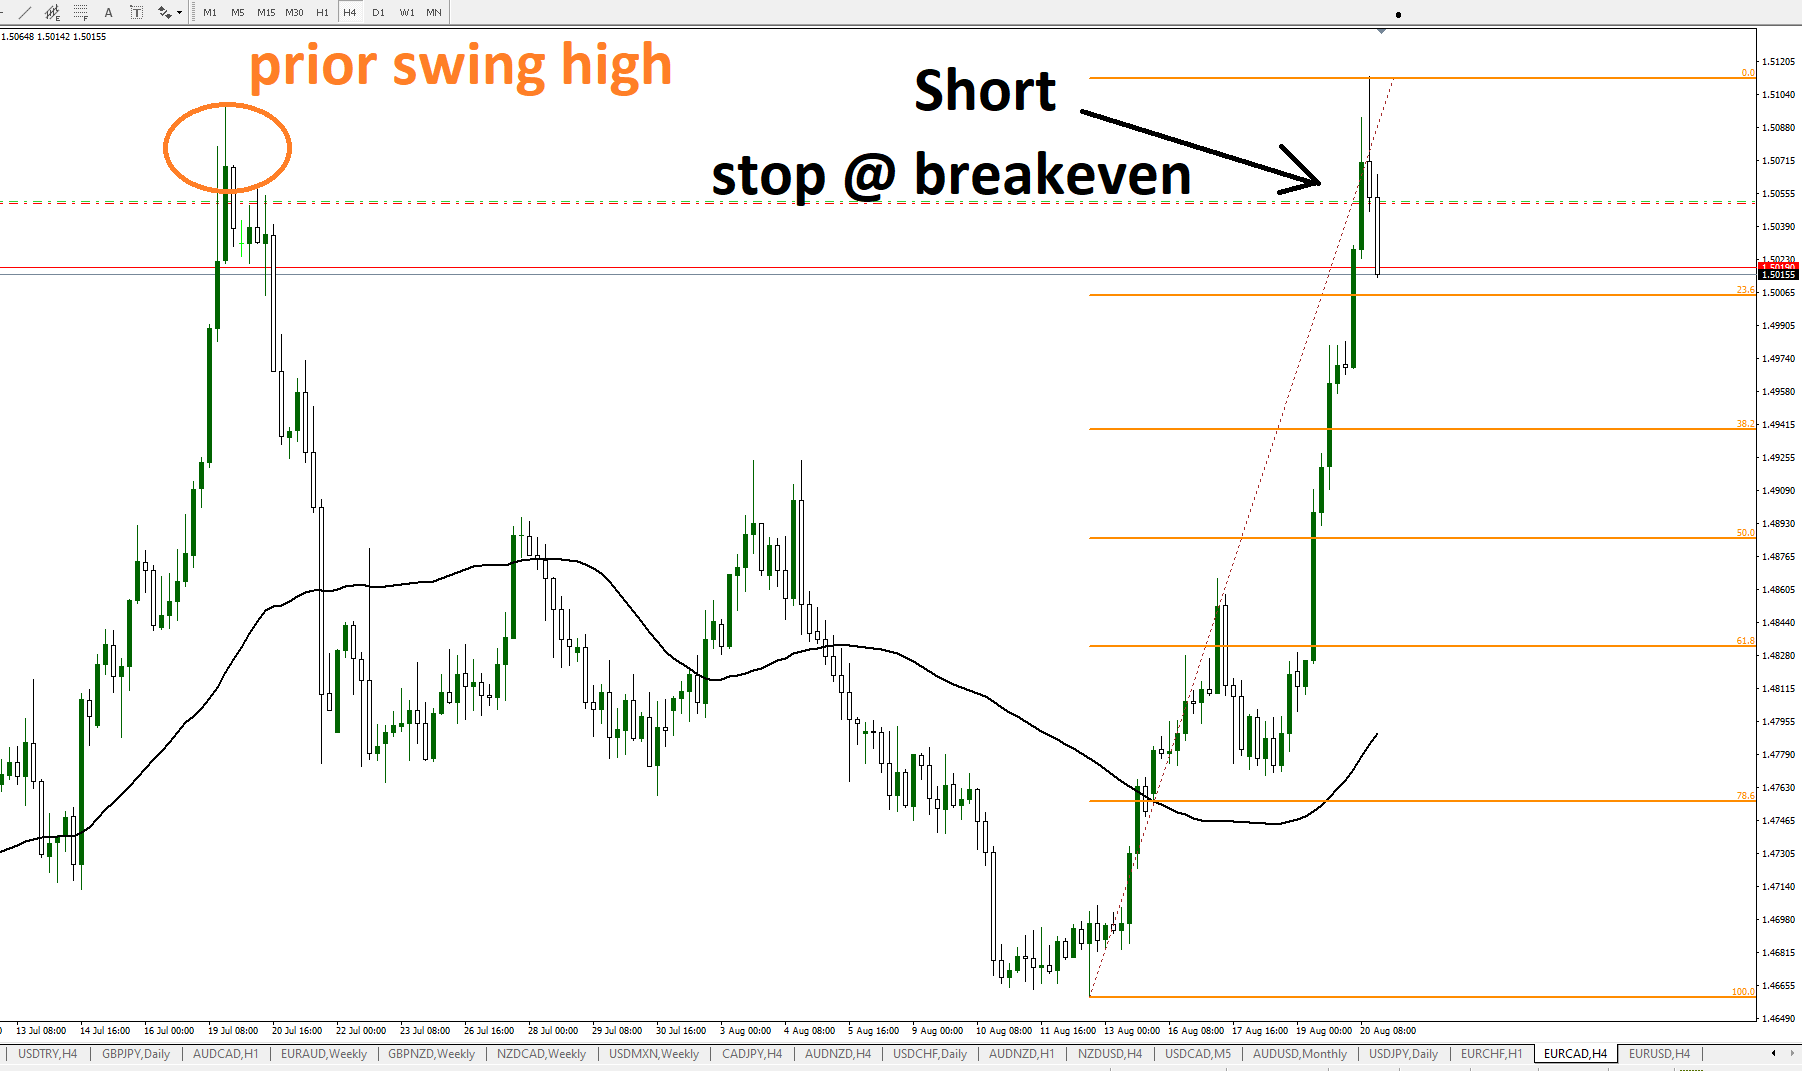
I noticed the price of this pair was at a level near a prior swing high. There was an opportunity shortly after the entry to get a stop loss order in at breakeven. That was done and now we’ll wait to see how the price action unfolds.

One objective of these posts is to show that trading is work and takes some effort. This position might get stopped out by the end of session today (Friday). That would be fine. There will be opportunities next week.

Dow short trade – 1 Minute Chart – Early U.S. Session

This trade yielded 189 points. There was a Fibonacci retracement drawn on a longer term time frame.

A short position was taken in anticipation of a trend line break. As happens frequently, price pushed higher after the trendline break, resulting in some sort of false breakout.

At a certain point while the trade was on, I placed a breakeven stop loss. Then I moved it to about +30 points. Then I exited manually. If you zoom out to a 5 minute chart, you’ll notice that price bounced around the area where there was a prior swing high.